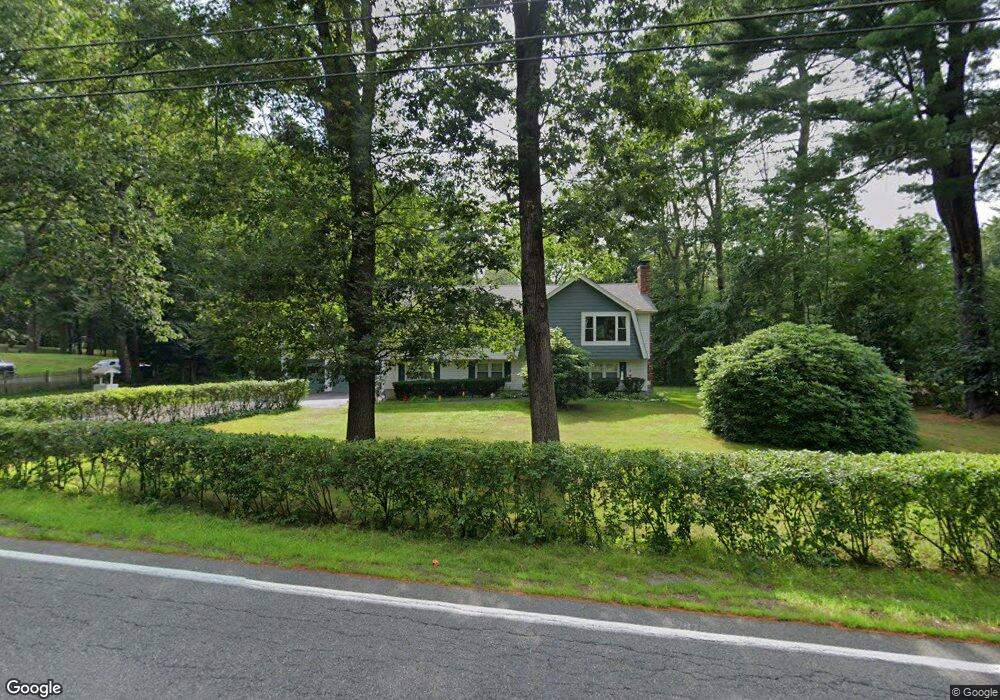
19 South Rd Londonderry, NH 03053
Estimated Value: $522,893 - $686,000
3
Beds
3
Baths
1,380
Sq Ft
$424/Sq Ft
Est. Value
About This Home
This home is located at 19 South Rd, Londonderry, NH 03053 and is currently estimated at $585,723, approximately $424 per square foot. 19 South Rd is a home with nearby schools including Londonderry Middle School, Londonderry Senior High School, and Southern New Hampshire Montessori Academy.
Ownership History
Date
Name
Owned For
Owner Type
Purchase Details
Closed on
Sep 19, 2000
Sold by
Johnson James F and Johnson Elaine B
Bought by
Burke Faith M
Current Estimated Value
Home Financials for this Owner
Home Financials are based on the most recent Mortgage that was taken out on this home.
Original Mortgage
$76,950
Interest Rate
8.07%
Purchase Details
Closed on
Sep 28, 1998
Sold by
Grass Sheldon L and Grass Linda E
Bought by
Charest Bruno J and Charest Betty L J
Purchase Details
Closed on
Aug 7, 1996
Sold by
Sanfacon Michael M and Sanfacon Susan B
Bought by
Lapham George E and Lapham Mary A
Home Financials for this Owner
Home Financials are based on the most recent Mortgage that was taken out on this home.
Original Mortgage
$80,000
Interest Rate
8.24%
Create a Home Valuation Report for This Property
The Home Valuation Report is an in-depth analysis detailing your home's value as well as a comparison with similar homes in the area
Home Values in the Area
Average Home Value in this Area
Purchase History
| Date | Buyer | Sale Price | Title Company |
|---|---|---|---|
| Burke Faith M | $81,000 | -- | |
| Charest Bruno J | $52,000 | -- | |
| Lapham George E | $118,900 | -- |
Source: Public Records
Mortgage History
| Date | Status | Borrower | Loan Amount |
|---|---|---|---|
| Open | Lapham George E | $330,000 | |
| Closed | Lapham George E | $76,950 | |
| Previous Owner | Lapham George E | $80,000 |
Source: Public Records
Tax History Compared to Growth
Tax History
| Year | Tax Paid | Tax Assessment Tax Assessment Total Assessment is a certain percentage of the fair market value that is determined by local assessors to be the total taxable value of land and additions on the property. | Land | Improvement |
|---|---|---|---|---|
| 2024 | $7,332 | $454,300 | $180,000 | $274,300 |
| 2023 | $7,110 | $454,300 | $180,000 | $274,300 |
| 2022 | $7,155 | $387,200 | $135,000 | $252,200 |
| 2021 | $7,095 | $386,000 | $135,000 | $251,000 |
| 2020 | $7,133 | $354,700 | $112,500 | $242,200 |
| 2019 | $8,158 | $353,100 | $112,500 | $240,600 |
| 2018 | $7,776 | $288,100 | $93,800 | $194,300 |
| 2017 | $7,568 | $288,100 | $93,800 | $194,300 |
| 2016 | $7,215 | $288,100 | $93,800 | $194,300 |
| 2015 | $6,056 | $288,100 | $93,800 | $194,300 |
| 2014 | $6,076 | $288,100 | $93,800 | $194,300 |
| 2011 | -- | $294,200 | $93,800 | $200,400 |
Source: Public Records
Map
Nearby Homes