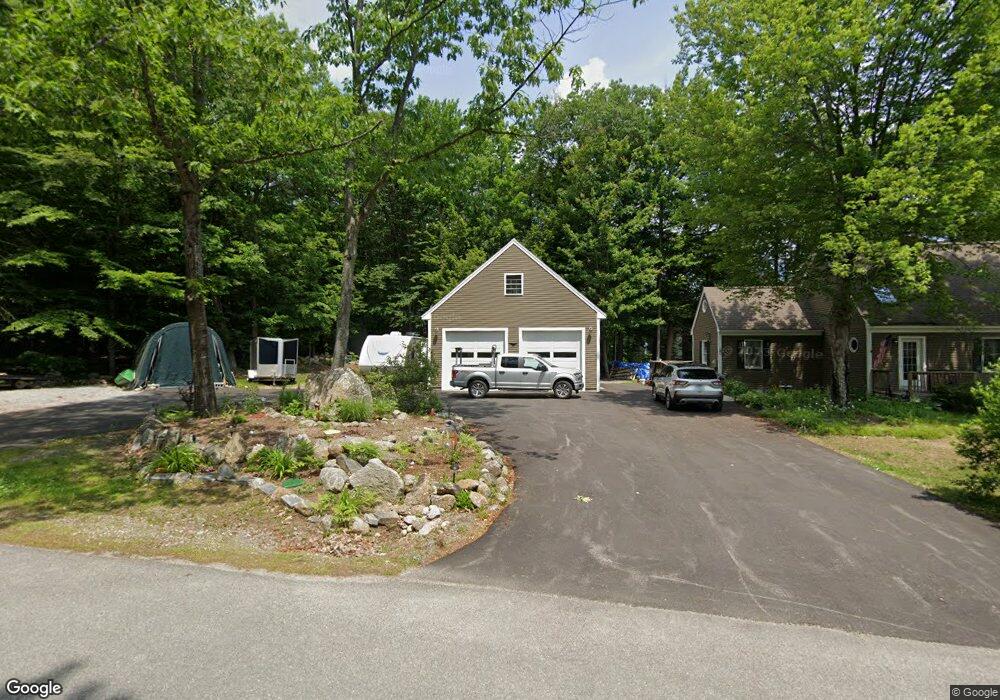
19 Symonds Rd Hillsborough, NH 03244
Hillsboro NeighborhoodEstimated Value: $515,592 - $611,000
3
Beds
2
Baths
1,952
Sq Ft
$283/Sq Ft
Est. Value
About This Home
This home is located at 19 Symonds Rd, Hillsborough, NH 03244 and is currently estimated at $552,148, approximately $282 per square foot. 19 Symonds Rd is a home located in Hillsborough County with nearby schools including Hillsboro-Deering Elementary School, Hillsboro-Deering High School, and Hillsboro Christian School.
Ownership History
Date
Name
Owned For
Owner Type
Purchase Details
Closed on
Apr 4, 2025
Sold by
Belanger George A
Bought by
Staley Joshua A and Titsworth Katherine E
Current Estimated Value
Home Financials for this Owner
Home Financials are based on the most recent Mortgage that was taken out on this home.
Original Mortgage
$495,000
Outstanding Balance
$492,024
Interest Rate
6.85%
Mortgage Type
Purchase Money Mortgage
Estimated Equity
$60,124
Create a Home Valuation Report for This Property
The Home Valuation Report is an in-depth analysis detailing your home's value as well as a comparison with similar homes in the area
Home Values in the Area
Average Home Value in this Area
Purchase History
| Date | Buyer | Sale Price | Title Company |
|---|---|---|---|
| Staley Joshua A | $550,000 | None Available | |
| Staley Joshua A | $550,000 | None Available |
Source: Public Records
Mortgage History
| Date | Status | Borrower | Loan Amount |
|---|---|---|---|
| Open | Staley Joshua A | $495,000 | |
| Closed | Staley Joshua A | $495,000 |
Source: Public Records
Tax History Compared to Growth
Tax History
| Year | Tax Paid | Tax Assessment Tax Assessment Total Assessment is a certain percentage of the fair market value that is determined by local assessors to be the total taxable value of land and additions on the property. | Land | Improvement |
|---|---|---|---|---|
| 2024 | $7,106 | $212,500 | $53,000 | $159,500 |
| 2023 | $6,634 | $212,500 | $53,000 | $159,500 |
| 2022 | $5,672 | $212,500 | $53,000 | $159,500 |
| 2021 | $6,146 | $212,500 | $53,000 | $159,500 |
| 2020 | $6,105 | $212,500 | $53,000 | $159,500 |
| 2018 | $5,443 | $184,500 | $36,800 | $147,700 |
| 2017 | $5,460 | $179,200 | $36,800 | $142,400 |
| 2016 | $4,756 | $161,100 | $32,900 | $128,200 |
| 2015 | $4,680 | $161,100 | $32,900 | $128,200 |
| 2014 | $4,440 | $161,100 | $32,900 | $128,200 |
| 2013 | $4,520 | $161,100 | $32,900 | $128,200 |
Source: Public Records
Map
Nearby Homes
- 0 W Main St Unit 1
- Lot 14 Old Mill Farm Rd
- 0 Route 202 Route Unit 4983445
- 23 Pleasant St
- 31 Woodlawn Ave
- 31 Central St Unit G
- 20-22 Church St
- 73 W Main St
- 1 W Main St
- 0 Center Rd
- 88 W Mill St
- 45 Keyes Farm Rd
- 9 Wyman Rd
- 5 Chamberlain Ct Unit 56
- 21 Wyman Rd
- 32 Union St
- 237 2nd New Hampshire Turnpike
- 447 Center Rd
- 298 2nd New Hampshire Turnpike Unit 10-038-000
- 298 2nd New Hampshire Turnpike