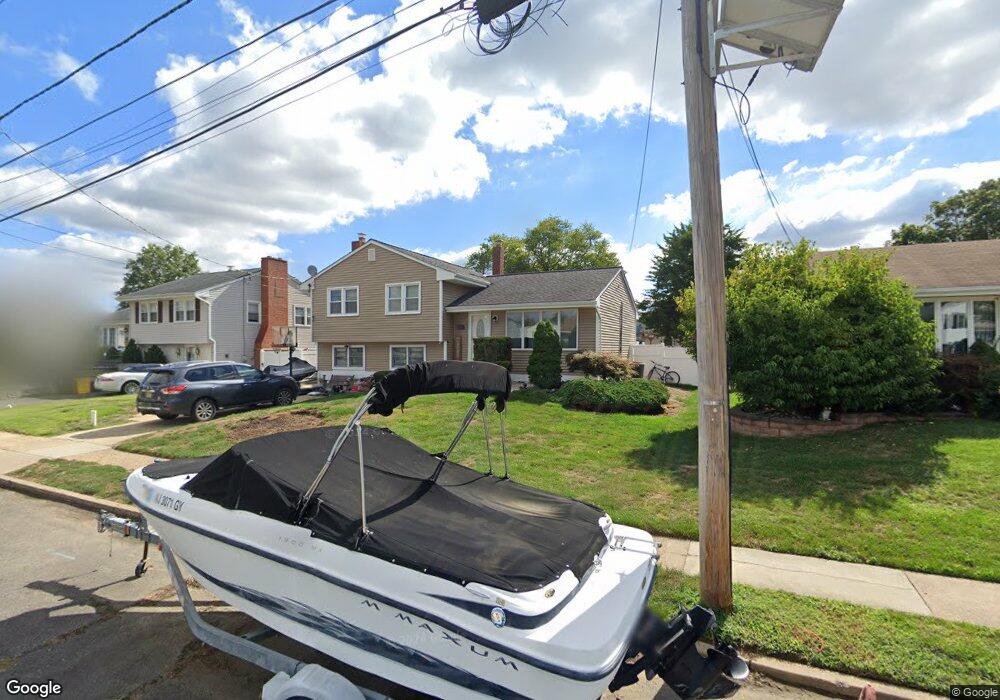
19 Toby Ln Trenton, NJ 08620
Estimated Value: $433,863 - $524,000
--
Bed
--
Bath
1,934
Sq Ft
$246/Sq Ft
Est. Value
About This Home
This home is located at 19 Toby Ln, Trenton, NJ 08620 and is currently estimated at $475,716, approximately $245 per square foot. 19 Toby Ln is a home located in Mercer County with nearby schools including Yardville Heights Elementary School, Albert E. Grice Middle School, and Hamilton West-Watson High School.
Ownership History
Date
Name
Owned For
Owner Type
Purchase Details
Closed on
Jun 1, 2005
Current Estimated Value
Purchase Details
Closed on
Oct 22, 2004
Sold by
Motto Joshua
Bought by
Cammisa Vito
Purchase Details
Closed on
Apr 5, 1999
Sold by
Zauner Living Trust
Bought by
Motto Michael and Motto Jason
Home Financials for this Owner
Home Financials are based on the most recent Mortgage that was taken out on this home.
Original Mortgage
$136,401
Interest Rate
7.02%
Mortgage Type
FHA
Create a Home Valuation Report for This Property
The Home Valuation Report is an in-depth analysis detailing your home's value as well as a comparison with similar homes in the area
Home Values in the Area
Average Home Value in this Area
Purchase History
| Date | Buyer | Sale Price | Title Company |
|---|---|---|---|
| -- | $235,000 | -- | |
| Cammisa Vito | $235,000 | -- | |
| Motto Michael | $136,500 | -- |
Source: Public Records
Mortgage History
| Date | Status | Borrower | Loan Amount |
|---|---|---|---|
| Previous Owner | Motto Michael | $136,401 |
Source: Public Records
Tax History Compared to Growth
Tax History
| Year | Tax Paid | Tax Assessment Tax Assessment Total Assessment is a certain percentage of the fair market value that is determined by local assessors to be the total taxable value of land and additions on the property. | Land | Improvement |
|---|---|---|---|---|
| 2025 | $8,637 | $245,100 | $78,000 | $167,100 |
| 2024 | $8,096 | $245,100 | $78,000 | $167,100 |
| 2023 | $8,096 | $245,100 | $78,000 | $167,100 |
| 2022 | $7,968 | $245,100 | $78,000 | $167,100 |
| 2021 | $8,561 | $245,100 | $78,000 | $167,100 |
| 2020 | $7,679 | $245,100 | $78,000 | $167,100 |
| 2019 | $7,512 | $245,100 | $78,000 | $167,100 |
| 2018 | $7,446 | $245,100 | $78,000 | $167,100 |
| 2017 | $7,260 | $245,100 | $78,000 | $167,100 |
| 2016 | $6,628 | $245,100 | $78,000 | $167,100 |
| 2015 | $6,991 | $150,700 | $53,000 | $97,700 |
| 2014 | $6,873 | $150,700 | $53,000 | $97,700 |
Source: Public Records
Map
Nearby Homes