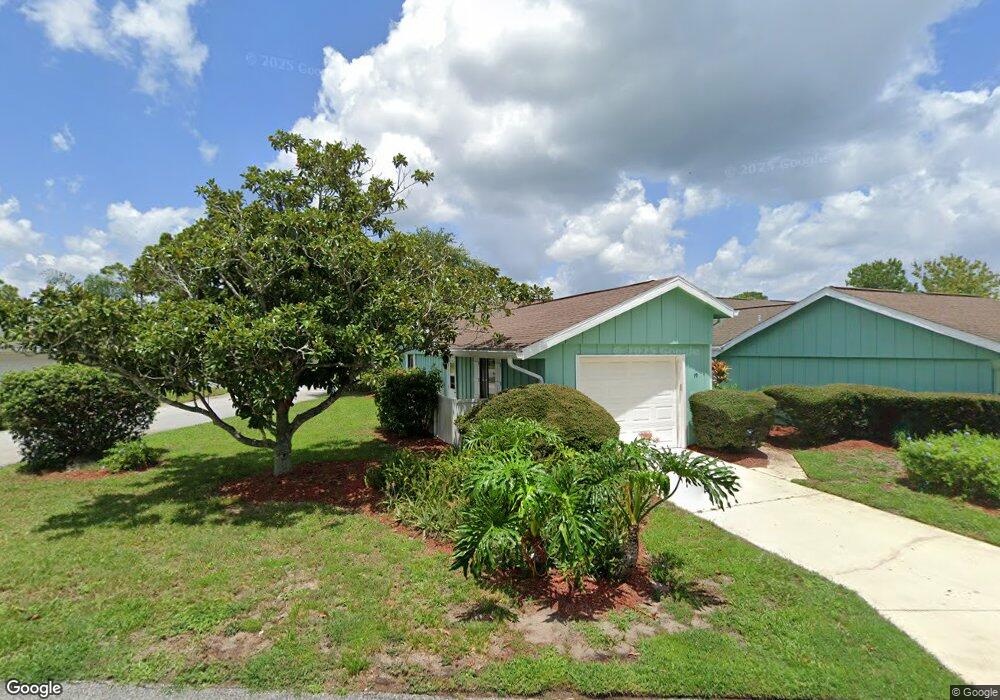
19 Trap Cir New Smyrna Beach, FL 32168
Fairway NeighborhoodEstimated Value: $201,000 - $250,000
1
Bed
2
Baths
1,056
Sq Ft
$215/Sq Ft
Est. Value
About This Home
This home is located at 19 Trap Cir, New Smyrna Beach, FL 32168 and is currently estimated at $227,358, approximately $215 per square foot. 19 Trap Cir is a home located in Volusia County with nearby schools including Chisholm Elementary School, New Smyrna Beach Middle School, and New Smyrna Beach High School.
Ownership History
Date
Name
Owned For
Owner Type
Purchase Details
Closed on
Feb 3, 1999
Sold by
Callahan Estelle
Bought by
Baumline Lawrence
Current Estimated Value
Home Financials for this Owner
Home Financials are based on the most recent Mortgage that was taken out on this home.
Original Mortgage
$42,400
Outstanding Balance
$10,122
Interest Rate
6.84%
Estimated Equity
$217,236
Purchase Details
Closed on
Mar 20, 1998
Sold by
Ganley Kyle Andrew and Ganley Kyle A
Bought by
Callahan Estelle
Purchase Details
Closed on
Mar 19, 1998
Sold by
Ganley David S and Ganley Helen P
Bought by
Callahan Estelle
Purchase Details
Closed on
Mar 17, 1998
Sold by
Ganley Scott Michael
Bought by
Callahan Estelle
Purchase Details
Closed on
Aug 15, 1978
Bought by
Baumline Lawrence
Create a Home Valuation Report for This Property
The Home Valuation Report is an in-depth analysis detailing your home's value as well as a comparison with similar homes in the area
Home Values in the Area
Average Home Value in this Area
Purchase History
| Date | Buyer | Sale Price | Title Company |
|---|---|---|---|
| Baumline Lawrence | $53,000 | -- | |
| Callahan Estelle | -- | -- | |
| Callahan Estelle | $52,000 | -- | |
| Callahan Estelle | -- | -- | |
| Baumline Lawrence | $33,800 | -- |
Source: Public Records
Mortgage History
| Date | Status | Borrower | Loan Amount |
|---|---|---|---|
| Open | Baumline Lawrence | $42,400 |
Source: Public Records
Tax History Compared to Growth
Tax History
| Year | Tax Paid | Tax Assessment Tax Assessment Total Assessment is a certain percentage of the fair market value that is determined by local assessors to be the total taxable value of land and additions on the property. | Land | Improvement |
|---|---|---|---|---|
| 2025 | $76 | $83,119 | -- | -- |
| 2024 | $76 | $80,777 | -- | -- |
| 2023 | $76 | $78,425 | $0 | $0 |
| 2022 | $74 | $76,141 | $0 | $0 |
| 2021 | $71 | $73,923 | $0 | $0 |
| 2020 | $69 | $72,902 | $0 | $0 |
| 2019 | $69 | $71,263 | $0 | $0 |
| 2018 | $68 | $69,934 | $0 | $0 |
| 2017 | $66 | $68,496 | $0 | $0 |
| 2016 | $65 | $67,087 | $0 | $0 |
| 2015 | $65 | $66,621 | $0 | $0 |
| 2014 | $65 | $66,092 | $0 | $0 |
Source: Public Records
Map
Nearby Homes