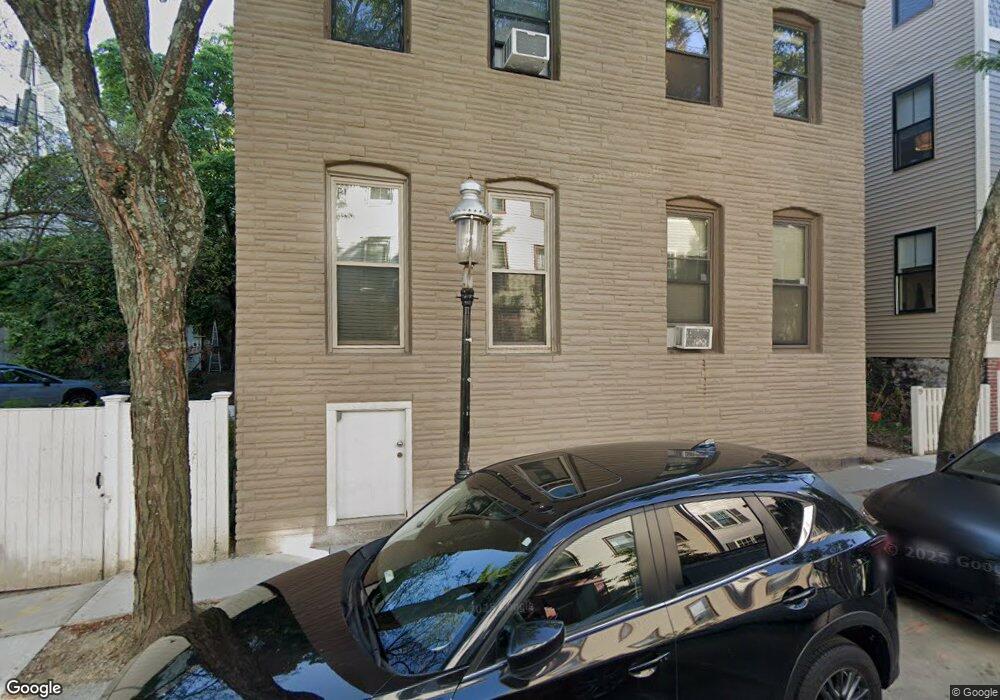
19 Tremont St Unit B Charlestown, MA 02129
Thompson Square-Bunker Hill NeighborhoodEstimated Value: $1,100,000 - $1,229,000
2
Beds
2
Baths
1,288
Sq Ft
$886/Sq Ft
Est. Value
About This Home
This home is located at 19 Tremont St Unit B, Charlestown, MA 02129 and is currently estimated at $1,140,676, approximately $885 per square foot. 19 Tremont St Unit B is a home located in Suffolk County with nearby schools including Boston Children's School and St John School.
Ownership History
Date
Name
Owned For
Owner Type
Purchase Details
Closed on
Mar 26, 2019
Sold by
Klein Andrew H and Branger Amy C
Bought by
Mcnabb Ronald S and Lacey Rebekah
Current Estimated Value
Home Financials for this Owner
Home Financials are based on the most recent Mortgage that was taken out on this home.
Original Mortgage
$648,000
Outstanding Balance
$569,707
Interest Rate
4.3%
Mortgage Type
New Conventional
Estimated Equity
$570,969
Purchase Details
Closed on
May 6, 2005
Sold by
Klein Andrew H
Bought by
Branger Amy C and Klein Andrew H
Purchase Details
Closed on
Feb 12, 1992
Sold by
Alin Rt
Bought by
Goulard Christopher M and Goulard Jenifer S
Create a Home Valuation Report for This Property
The Home Valuation Report is an in-depth analysis detailing your home's value as well as a comparison with similar homes in the area
Home Values in the Area
Average Home Value in this Area
Purchase History
| Date | Buyer | Sale Price | Title Company |
|---|---|---|---|
| Mcnabb Ronald S | $810,000 | -- | |
| Branger Amy C | -- | -- | |
| Goulard Christopher M | $108,000 | -- |
Source: Public Records
Mortgage History
| Date | Status | Borrower | Loan Amount |
|---|---|---|---|
| Open | Mcnabb Ronald S | $648,000 | |
| Previous Owner | Goulard Christopher M | $25,000 | |
| Previous Owner | Goulard Christopher M | $350,000 | |
| Previous Owner | Goulard Christopher M | $307,000 |
Source: Public Records
Tax History Compared to Growth
Tax History
| Year | Tax Paid | Tax Assessment Tax Assessment Total Assessment is a certain percentage of the fair market value that is determined by local assessors to be the total taxable value of land and additions on the property. | Land | Improvement |
|---|---|---|---|---|
| 2025 | $10,802 | $932,800 | $0 | $932,800 |
| 2024 | $9,613 | $881,900 | $0 | $881,900 |
| 2023 | $9,013 | $839,200 | $0 | $839,200 |
| 2022 | $8,777 | $806,700 | $0 | $806,700 |
| 2021 | $8,439 | $790,900 | $0 | $790,900 |
| 2020 | $9,253 | $876,200 | $0 | $876,200 |
| 2019 | $8,627 | $818,500 | $0 | $818,500 |
| 2018 | $8,170 | $779,600 | $0 | $779,600 |
| 2017 | $8,012 | $756,600 | $0 | $756,600 |
| 2016 | $7,926 | $720,500 | $0 | $720,500 |
| 2015 | $6,200 | $512,000 | $0 | $512,000 |
| 2014 | $5,735 | $455,900 | $0 | $455,900 |
Source: Public Records
Map
Nearby Homes
- 5 Wallace Ct
- 106 Bunker Hill St Unit 2
- 106 Bunker Hill St Unit 6
- 106 Bunker Hill St Unit 1
- 106 Bunker Hill St Unit 4P
- 106 Bunker Hill St Unit 3
- 12 Prospect St Unit 2
- 12 Prospect St Unit 1
- 172 Bunker Hill St Unit 1
- 46 High St
- 73 Chelsea St Unit 401
- 56 High St Unit 3
- 207 Bunker Hill St Unit 2
- 17 Henley St Unit F
- 17 Henley St Unit B
- 254-256 Medford St Unit 2
- 247 Bunker Hill St Unit A
- 9 Russell St Unit 2
- 9 Russell St Unit 1
- 22 Harvard St
- 19 Tremont St Unit A
- 19 Tremont St Unit 2
- 21 Tremont St Unit B
- 21 Tremont St Unit A
- 17 Tremont St
- 17 Tremont St
- 17 Tremont St Unit 1
- 17 Tremont St Unit 2
- 17 Tremont St Unit 3
- 1 Mount Vernon St
- 15 Tremont St
- 15 Tremont St Unit 1
- 15 Tremont St Unit 2
- 15 Tremont St Unit 3
- 1-3 Nearen Row Unit 1
- 1-3 Nearen Row
- 3 Nearen Row Unit B
- 3 Nearen Row Unit 3
- 3 Nearen Row Unit A
- 3 Nearen Row