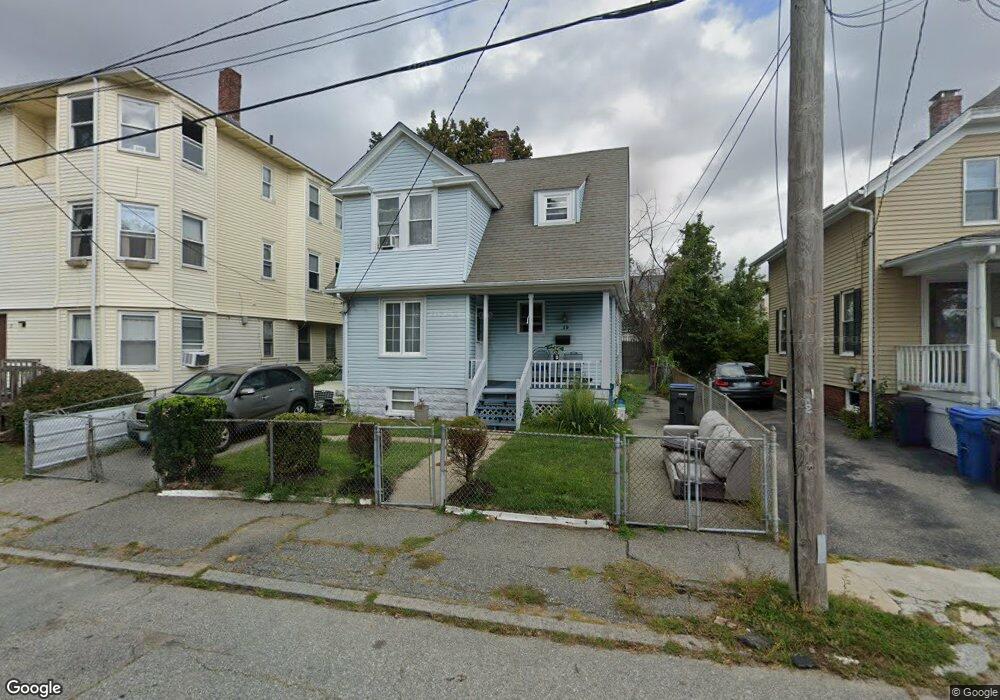
19 Villa Ave Cranston, RI 02905
Edgewood NeighborhoodEstimated Value: $331,000 - $392,000
3
Beds
2
Baths
1,003
Sq Ft
$361/Sq Ft
Est. Value
About This Home
This home is located at 19 Villa Ave, Cranston, RI 02905 and is currently estimated at $362,558, approximately $361 per square foot. 19 Villa Ave is a home located in Providence County with nearby schools including Edgewood Highland Elementary School, Edward S. Rhodes School, and Park View Middle School.
Ownership History
Date
Name
Owned For
Owner Type
Purchase Details
Closed on
Jul 30, 2024
Sold by
Celtic Roman Grp Llc
Bought by
Suggs Charlena R
Current Estimated Value
Home Financials for this Owner
Home Financials are based on the most recent Mortgage that was taken out on this home.
Original Mortgage
$300,457
Outstanding Balance
$296,328
Interest Rate
6.25%
Mortgage Type
FHA
Estimated Equity
$66,230
Purchase Details
Closed on
Apr 21, 2010
Sold by
Brown Clarence O
Bought by
Celtis Roman Group Llc
Home Financials for this Owner
Home Financials are based on the most recent Mortgage that was taken out on this home.
Original Mortgage
$87,782
Interest Rate
5%
Mortgage Type
Purchase Money Mortgage
Purchase Details
Closed on
Oct 19, 1989
Sold by
Cranston Ptnrshp
Bought by
Brown Clarence P
Create a Home Valuation Report for This Property
The Home Valuation Report is an in-depth analysis detailing your home's value as well as a comparison with similar homes in the area
Home Values in the Area
Average Home Value in this Area
Purchase History
| Date | Buyer | Sale Price | Title Company |
|---|---|---|---|
| Suggs Charlena R | $306,000 | None Available | |
| Suggs Charlena R | $306,000 | None Available | |
| Celtis Roman Group Llc | $84,500 | -- | |
| Brown Clarence P | $85,000 | -- | |
| Celtis Roman Group Llc | $84,500 | -- | |
| Brown Clarence P | $85,000 | -- |
Source: Public Records
Mortgage History
| Date | Status | Borrower | Loan Amount |
|---|---|---|---|
| Open | Suggs Charlena R | $300,457 | |
| Closed | Suggs Charlena R | $300,457 | |
| Previous Owner | Brown Clarence P | $969,000 | |
| Previous Owner | Brown Clarence P | $91,000 | |
| Previous Owner | Brown Clarence P | $87,782 |
Source: Public Records
Tax History Compared to Growth
Tax History
| Year | Tax Paid | Tax Assessment Tax Assessment Total Assessment is a certain percentage of the fair market value that is determined by local assessors to be the total taxable value of land and additions on the property. | Land | Improvement |
|---|---|---|---|---|
| 2025 | $3,979 | $286,700 | $96,700 | $190,000 |
| 2024 | $3,796 | $278,900 | $96,700 | $182,200 |
| 2023 | $3,755 | $198,700 | $66,700 | $132,000 |
| 2022 | $3,678 | $198,700 | $66,700 | $132,000 |
| 2021 | $3,577 | $198,700 | $66,700 | $132,000 |
| 2020 | $3,545 | $170,700 | $69,900 | $100,800 |
| 2019 | $3,545 | $170,700 | $69,900 | $100,800 |
| 2018 | $3,464 | $170,700 | $69,900 | $100,800 |
| 2017 | $3,397 | $148,100 | $63,500 | $84,600 |
| 2016 | $3,325 | $148,100 | $63,500 | $84,600 |
| 2015 | $3,325 | $148,100 | $63,500 | $84,600 |
| 2014 | $3,289 | $144,000 | $63,500 | $80,500 |
Source: Public Records
Map
Nearby Homes
- 19 Warwick Ave
- 112 Villa Ave
- 10 Sylvan Ave
- 28 Sylvan Ave
- 177 Arnold Ave
- 27 Cliffdale Ave
- 42 Netherlands Ave
- 171 Norwood Ave
- 14 Park Ave
- 68 Cliffdale Ave
- 126 Columbia Ave
- 98 Columbia Ave
- 114 Norwood Ave
- 88 Wentworth Ave
- 15 Wheeler Ave
- 22 Community Dr
- 51 Columbia Ave
- 1291 Narragansett Blvd Unit 4
- 303 Narragansett St
- 12 Harbour Terrace