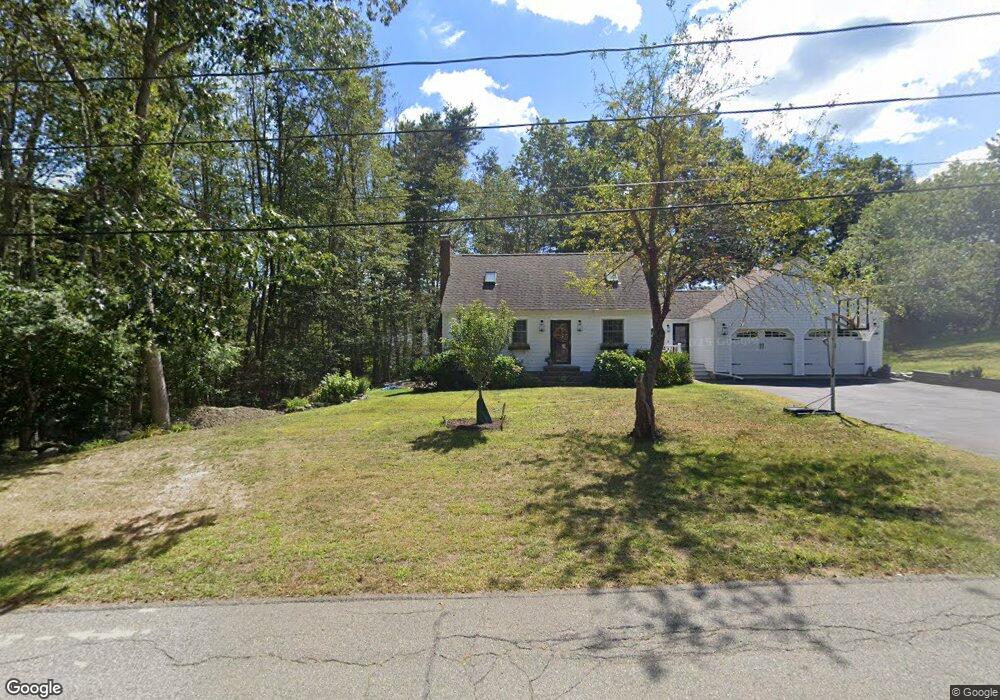
19 Vine St Hanover, MA 02339
Estimated Value: $655,000 - $780,000
3
Beds
2
Baths
1,502
Sq Ft
$471/Sq Ft
Est. Value
About This Home
This home is located at 19 Vine St, Hanover, MA 02339 and is currently estimated at $707,896, approximately $471 per square foot. 19 Vine St is a home located in Plymouth County with nearby schools including Hanover High School, Calvary Chapel Academy, and Holy Family Elementary School.
Ownership History
Date
Name
Owned For
Owner Type
Purchase Details
Closed on
May 25, 2022
Sold by
Morrill Darrell E and Morrill Nancy C
Bought by
Morrill Ft
Current Estimated Value
Purchase Details
Closed on
Sep 27, 2002
Sold by
Joslin Michael R and Joslin Kelly A
Bought by
Morrill Darryl E and Morrill Nancy C
Purchase Details
Closed on
May 28, 1999
Sold by
Plansky Joanne M
Bought by
Joslin Michael R and Joslin Kelly A
Create a Home Valuation Report for This Property
The Home Valuation Report is an in-depth analysis detailing your home's value as well as a comparison with similar homes in the area
Home Values in the Area
Average Home Value in this Area
Purchase History
| Date | Buyer | Sale Price | Title Company |
|---|---|---|---|
| Morrill Ft | -- | None Available | |
| Morrill Darryl E | $388,900 | -- | |
| Joslin Michael R | $247,100 | -- |
Source: Public Records
Mortgage History
| Date | Status | Borrower | Loan Amount |
|---|---|---|---|
| Previous Owner | Joslin Michael R | $245,000 | |
| Previous Owner | Joslin Michael R | $228,000 | |
| Previous Owner | Joslin Michael R | $233,000 |
Source: Public Records
Tax History Compared to Growth
Tax History
| Year | Tax Paid | Tax Assessment Tax Assessment Total Assessment is a certain percentage of the fair market value that is determined by local assessors to be the total taxable value of land and additions on the property. | Land | Improvement |
|---|---|---|---|---|
| 2025 | $7,436 | $602,100 | $270,100 | $332,000 |
| 2024 | $7,260 | $565,400 | $270,100 | $295,300 |
| 2023 | $6,947 | $515,000 | $245,500 | $269,500 |
| 2022 | $7,366 | $483,000 | $245,500 | $237,500 |
| 2021 | $7,378 | $451,800 | $223,100 | $228,700 |
| 2020 | $7,304 | $447,800 | $223,100 | $224,700 |
| 2019 | $6,858 | $417,900 | $223,100 | $194,800 |
| 2018 | $6,740 | $414,000 | $223,100 | $190,900 |
| 2017 | $6,359 | $384,900 | $211,100 | $173,800 |
| 2016 | $6,235 | $369,800 | $191,900 | $177,900 |
| 2015 | $5,840 | $361,600 | $191,900 | $169,700 |
Source: Public Records
Map
Nearby Homes
- 216 Whiting St
- 206-208 Hinghm St
- 436 E Water St
- 354 Webster St
- 120 Deerfield Ln
- 18 Midfield Dr
- 507 Liberty St
- 92 Liberty St
- 49 Liberty St
- 63 Webster St
- 118 Bates Way
- 45-47 Park St
- 718 Market St
- 133 Crescent St
- 38 Levin Rd
- 94-96 Crescent St
- 13 Dyer St Unit 13
- 14 Dyer St Unit 14
- 12 Dyer St Unit 12
- 737-739 Union St