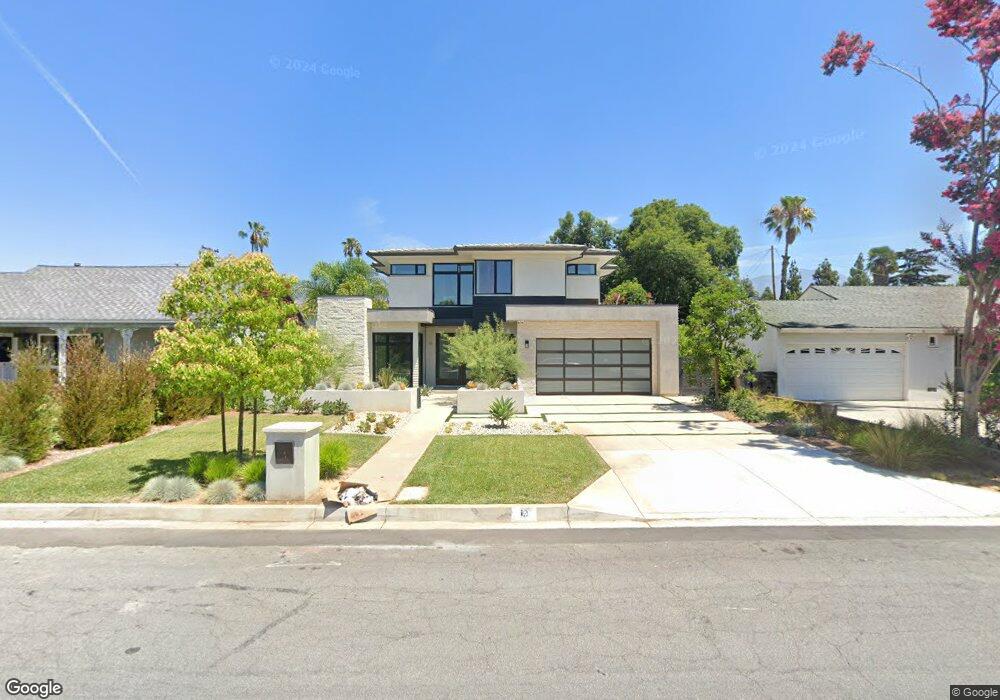
19 W Naomi Ave Arcadia, CA 91007
Estimated Value: $1,671,000 - $2,650,145
3
Beds
2
Baths
3,334
Sq Ft
$710/Sq Ft
Est. Value
About This Home
This home is located at 19 W Naomi Ave, Arcadia, CA 91007 and is currently estimated at $2,366,036, approximately $709 per square foot. 19 W Naomi Ave is a home located in Los Angeles County with nearby schools including Baldwin Stocker Elementary School, First Avenue Middle School, and Arcadia High School.
Ownership History
Date
Name
Owned For
Owner Type
Purchase Details
Closed on
Jan 12, 2015
Sold by
Wong Daric W
Bought by
Shen Tony and Shen Lisa W
Current Estimated Value
Purchase Details
Closed on
Feb 23, 2002
Sold by
Wong Daric W and Wong Daric Wing Sang
Bought by
Wong Daric W
Purchase Details
Closed on
Oct 11, 2001
Sold by
Lin Kuo Chung and Lin Chengi Chen
Bought by
Wong Daric Wing Sang
Home Financials for this Owner
Home Financials are based on the most recent Mortgage that was taken out on this home.
Original Mortgage
$297,000
Interest Rate
6.88%
Purchase Details
Closed on
Mar 25, 1994
Sold by
Ballance Thaxton A and Ballance Virginia O
Bought by
Lin Kuo Chung
Home Financials for this Owner
Home Financials are based on the most recent Mortgage that was taken out on this home.
Original Mortgage
$172,500
Interest Rate
8.3%
Create a Home Valuation Report for This Property
The Home Valuation Report is an in-depth analysis detailing your home's value as well as a comparison with similar homes in the area
Home Values in the Area
Average Home Value in this Area
Purchase History
| Date | Buyer | Sale Price | Title Company |
|---|---|---|---|
| Shen Tony | $1,000,000 | Chicago Title Company | |
| Wong Daric W | -- | -- | |
| Wong Daric Wing Sang | $396,000 | South Coast Title | |
| Wong Daric Wing Sang | -- | South Coast Title | |
| Lin Kuo Chung | $345,000 | Land Title |
Source: Public Records
Mortgage History
| Date | Status | Borrower | Loan Amount |
|---|---|---|---|
| Previous Owner | Wong Daric Wing Sang | $297,000 | |
| Previous Owner | Lin Kuo Chung | $172,500 |
Source: Public Records
Tax History Compared to Growth
Tax History
| Year | Tax Paid | Tax Assessment Tax Assessment Total Assessment is a certain percentage of the fair market value that is determined by local assessors to be the total taxable value of land and additions on the property. | Land | Improvement |
|---|---|---|---|---|
| 2025 | $19,575 | $1,770,107 | $961,476 | $808,631 |
| 2024 | $19,575 | $1,735,400 | $942,624 | $792,776 |
| 2023 | $19,164 | $1,701,374 | $924,142 | $777,232 |
| 2022 | $16,130 | $1,672,482 | $906,022 | $766,460 |
| 2021 | $12,901 | $1,158,257 | $888,257 | $270,000 |
| 2019 | $12,203 | $1,077,390 | $861,912 | $215,478 |
| 2018 | $11,896 | $1,056,265 | $845,012 | $211,253 |
| 2016 | $11,623 | $1,015,250 | $812,200 | $203,050 |
| 2015 | $5,806 | $486,750 | $314,546 | $172,204 |
| 2014 | $5,731 | $477,216 | $308,385 | $168,831 |
Source: Public Records
Map
Nearby Homes
- 1317 S Santa Anita Ave
- 77 W Naomi Ave
- 1122 S Santa Anita Ave
- 1036 Louise Ave
- 42 W Winnie Way
- 27 Christina St
- 194 W Pamela Rd
- 1780 S Santa Anita Ave
- 1327 S 2nd Ave
- 1025 S 2nd Ave
- 239 W Norman Ave
- 1801 Lee Ave
- 1825 Lee Ave
- 45 Genoa St Unit A
- 1010 Park Ave
- 312 E Camino Real Ave
- 202 W Lemon Ave
- 182 W Wistaria Ave
- 25 Fano St
- 4312 Jasmine Ln
- 15 W Naomi Ave
- 25 W Naomi Ave
- 29 W Naomi Ave
- 18 W Le Roy Ave
- 14 W Le Roy Ave
- 24 W Le Roy Ave
- 1331 S Santa Anita Ave
- 28 W Le Roy Ave
- 1323 S Santa Anita Ave
- 35 W Naomi Ave
- 18 W Naomi Ave
- 24 W Naomi Ave
- 8 W Naomi Ave
- 36 W Le Roy Ave
- 28 W Naomi Ave
- 1401 S Santa Anita Ave
- 39 W Naomi Ave
- 34 W Naomi Ave
- 38 W Le Roy Ave
- 34 W Le Roy Ave