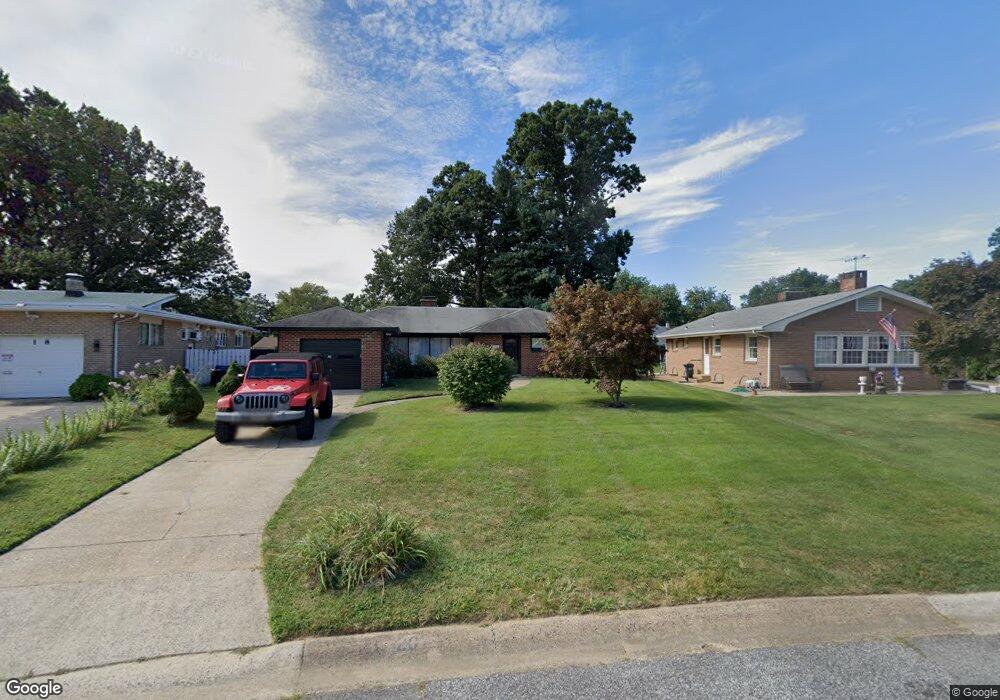
19 W Queen Ave New Castle, DE 19720
Estimated Value: $370,392 - $434,000
3
Beds
3
Baths
1,600
Sq Ft
$244/Sq Ft
Est. Value
About This Home
This home is located at 19 W Queen Ave, New Castle, DE 19720 and is currently estimated at $390,098, approximately $243 per square foot. 19 W Queen Ave is a home with nearby schools including Castle Hills Elementary School, Read (George) Middle School, and Delaware Valley Classical School.
Ownership History
Date
Name
Owned For
Owner Type
Purchase Details
Closed on
Aug 19, 2016
Sold by
Jenkins Lawrence W
Bought by
Basilio Sergio Medina
Current Estimated Value
Home Financials for this Owner
Home Financials are based on the most recent Mortgage that was taken out on this home.
Original Mortgage
$250,381
Outstanding Balance
$201,498
Interest Rate
3.75%
Mortgage Type
FHA
Estimated Equity
$188,600
Purchase Details
Closed on
Jan 29, 1999
Bought by
Jenkins Lawrence W
Create a Home Valuation Report for This Property
The Home Valuation Report is an in-depth analysis detailing your home's value as well as a comparison with similar homes in the area
Home Values in the Area
Average Home Value in this Area
Purchase History
| Date | Buyer | Sale Price | Title Company |
|---|---|---|---|
| Basilio Sergio Medina | -- | None Available | |
| Jenkins Lawrence W | $119,900 | -- |
Source: Public Records
Mortgage History
| Date | Status | Borrower | Loan Amount |
|---|---|---|---|
| Open | Basilio Sergio Medina | $250,381 |
Source: Public Records
Tax History
| Year | Tax Paid | Tax Assessment Tax Assessment Total Assessment is a certain percentage of the fair market value that is determined by local assessors to be the total taxable value of land and additions on the property. | Land | Improvement |
|---|---|---|---|---|
| 2024 | $203 | $65,100 | $7,800 | $57,300 |
| 2023 | $1,968 | $65,100 | $7,800 | $57,300 |
| 2022 | $2,064 | $65,100 | $7,800 | $57,300 |
| 2021 | $2,064 | $65,100 | $7,800 | $57,300 |
| 2020 | $2,078 | $65,100 | $7,800 | $57,300 |
| 2019 | $2,396 | $65,100 | $7,800 | $57,300 |
| 2018 | $1,960 | $62,700 | $7,800 | $54,900 |
| 2017 | $1,831 | $62,700 | $7,800 | $54,900 |
| 2016 | $1,136 | $62,700 | $7,800 | $54,900 |
| 2015 | -- | $62,700 | $7,800 | $54,900 |
| 2014 | -- | $62,700 | $7,800 | $54,900 |
Source: Public Records
Map
Nearby Homes
- 108 Iroquois Ct
- 170 Airport Rd
- 14 Cherry Rd
- 10 Addison Dr
- 11 Dunsinane Dr
- 12 Dunsinane Dr
- 53 E Edinburgh Dr
- 6 Chiming Rd
- 4 Rambo Terrace
- 17 Richard Rd
- 22 Raintree Dr
- 20 Rambleton Dr
- 15 Mark Dr
- 203 Silview Ave
- 85 Mackenzie Ct
- 154 Freedom Trail
- 109 Lindberg Ave
- 213 Highland Blvd Unit 44
- 105 Harding Ave
- 139 Denn Place
Your Personal Tour Guide
Ask me questions while you tour the home.