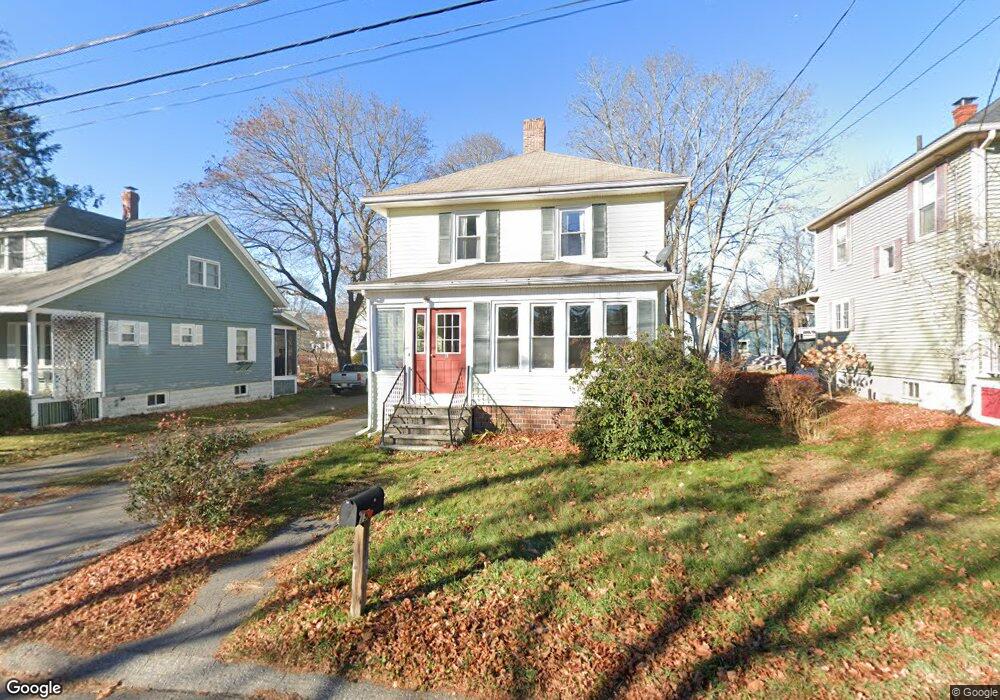
19 Webster Ave Westbrook, ME 04092
Estimated Value: $400,000 - $503,000
3
Beds
1
Bath
1,442
Sq Ft
$316/Sq Ft
Est. Value
About This Home
This home is located at 19 Webster Ave, Westbrook, ME 04092 and is currently estimated at $455,738, approximately $316 per square foot. 19 Webster Ave is a home located in Cumberland County with nearby schools including Westbrook High School and Breakwater School.
Ownership History
Date
Name
Owned For
Owner Type
Purchase Details
Closed on
May 2, 2018
Sold by
Baillargeon Dorothy
Bought by
Richmond Susan and Johnson Douglas
Current Estimated Value
Home Financials for this Owner
Home Financials are based on the most recent Mortgage that was taken out on this home.
Original Mortgage
$190,400
Outstanding Balance
$164,129
Interest Rate
4.45%
Mortgage Type
New Conventional
Estimated Equity
$291,609
Purchase Details
Closed on
Oct 2, 2008
Sold by
Mcgonagle Lucretia A and Dadiego Lucretia A
Bought by
Baillargeon Dorothy
Create a Home Valuation Report for This Property
The Home Valuation Report is an in-depth analysis detailing your home's value as well as a comparison with similar homes in the area
Purchase History
| Date | Buyer | Sale Price | Title Company |
|---|---|---|---|
| Richmond Susan | -- | -- | |
| Baillargeon Dorothy | -- | -- |
Source: Public Records
Mortgage History
| Date | Status | Borrower | Loan Amount |
|---|---|---|---|
| Open | Richmond Susan | $190,400 | |
| Previous Owner | Baillargeon Dorothy | $160,000 |
Source: Public Records
Tax History
| Year | Tax Paid | Tax Assessment Tax Assessment Total Assessment is a certain percentage of the fair market value that is determined by local assessors to be the total taxable value of land and additions on the property. | Land | Improvement |
|---|---|---|---|---|
| 2023 | $4,404 | $264,000 | $88,600 | $175,400 |
| 2022 | $3,980 | $219,900 | $73,800 | $146,100 |
| 2021 | $3,921 | $219,900 | $73,800 | $146,100 |
| 2020 | $2,359 | $219,900 | $73,800 | $146,100 |
| 2019 | $2,284 | $219,900 | $73,800 | $146,100 |
| 2018 | $3,867 | $199,200 | $64,200 | $135,000 |
| 2017 | $2,449 | $199,200 | $64,200 | $135,000 |
| 2016 | $3,665 | $199,200 | $64,200 | $135,000 |
| 2015 | $3,578 | $199,200 | $64,200 | $135,000 |
| 2014 | $3,426 | $199,200 | $64,200 | $135,000 |
| 2013 | $3,426 | $199,200 | $64,200 | $135,000 |
Source: Public Records
Map
Nearby Homes
- 22 Berkeley St
- 16 Chickadee Ln
- 141 Rochester St
- 25 Lawrence St Unit 54
- 84 Hillside Rd
- 96 Holm Ave
- 21 Clover Ln Unit 210
- 21 Clover Ln Unit 306
- 21 Clover Ln Unit 407
- 21 Clover Ln Unit 207
- 21 Clover Ln Unit 212
- 21 Clover Ln Unit 107
- 21 Clover Ln Unit 209
- 21 Clover Ln Unit 104
- 24 Celebration Ct Unit 13
- 272 Cumberland St
- 5 Apex Dr Unit 1
- 7 Apex Dr Unit 2
- 1 Dale Ct Unit 1
- 18 Cole St
Your Personal Tour Guide
Ask me questions while you tour the home.