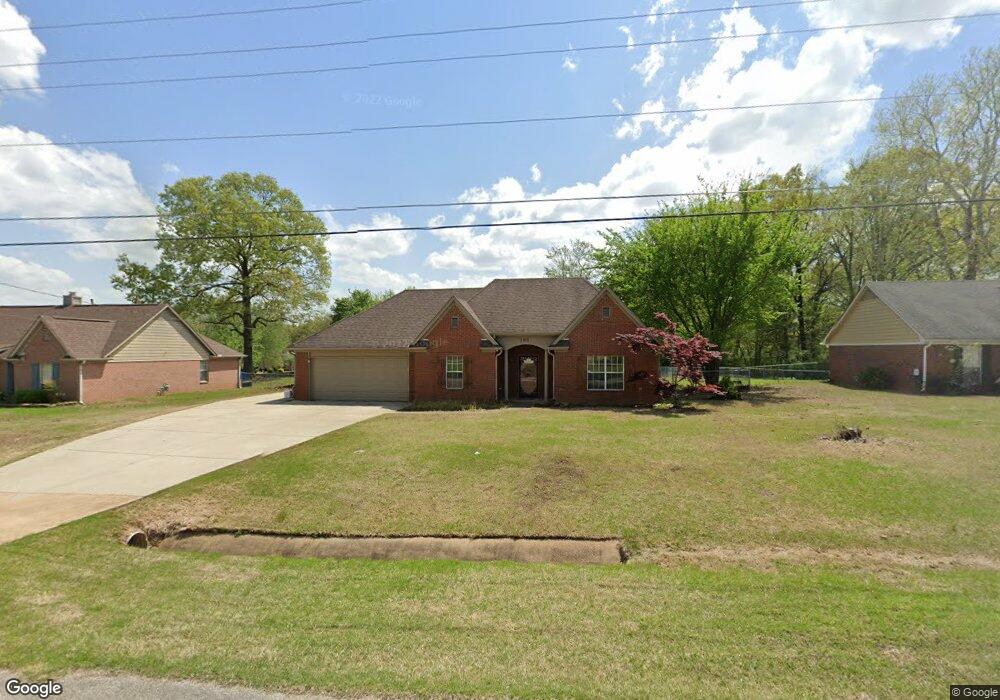
190 Country Place Oakland, TN 38060
Estimated Value: $243,475 - $286,000
--
Bed
2
Baths
1,420
Sq Ft
$186/Sq Ft
Est. Value
About This Home
This home is located at 190 Country Place, Oakland, TN 38060 and is currently estimated at $264,619, approximately $186 per square foot. 190 Country Place is a home located in Fayette County with nearby schools including Oakland Elementary School, West Junior High School, and Fayette Ware Comprehensive High School.
Ownership History
Date
Name
Owned For
Owner Type
Purchase Details
Closed on
Jan 22, 2021
Sold by
Rector Kelly L
Bought by
Rutland Brian Matthew
Current Estimated Value
Home Financials for this Owner
Home Financials are based on the most recent Mortgage that was taken out on this home.
Original Mortgage
$200,101
Outstanding Balance
$178,591
Interest Rate
2.71%
Mortgage Type
New Conventional
Estimated Equity
$86,028
Purchase Details
Closed on
Jul 31, 2013
Sold by
Goodwin Homes Llc
Bought by
Bogard Lawren and Bogard Veronica
Purchase Details
Closed on
Apr 10, 2013
Sold by
Goodwin Homes Llc
Bought by
Guidi Mary Nunan and Guidi Lawrence J
Purchase Details
Closed on
Mar 1, 1999
Sold by
Rector Kelly L
Bought by
Rector Kellie L
Purchase Details
Closed on
Sep 19, 1994
Purchase Details
Closed on
Sep 16, 1994
Bought by
Chandler Garry L and Ruth Ann
Purchase Details
Closed on
Jan 25, 1994
Create a Home Valuation Report for This Property
The Home Valuation Report is an in-depth analysis detailing your home's value as well as a comparison with similar homes in the area
Home Values in the Area
Average Home Value in this Area
Purchase History
| Date | Buyer | Sale Price | Title Company |
|---|---|---|---|
| Rutland Brian Matthew | $198,100 | Edco Ttl & Closing Svcs Inc | |
| Bogard Lawren | $214,000 | -- | |
| Guidi Mary Nunan | $227,850 | -- | |
| Rector Kellie L | -- | -- | |
| -- | -- | -- | |
| Chandler Garry L | $345,000 | -- | |
| -- | -- | -- |
Source: Public Records
Mortgage History
| Date | Status | Borrower | Loan Amount |
|---|---|---|---|
| Open | Rutland Brian Matthew | $200,101 |
Source: Public Records
Tax History Compared to Growth
Tax History
| Year | Tax Paid | Tax Assessment Tax Assessment Total Assessment is a certain percentage of the fair market value that is determined by local assessors to be the total taxable value of land and additions on the property. | Land | Improvement |
|---|---|---|---|---|
| 2024 | $560 | $44,150 | $10,000 | $34,150 |
| 2023 | $1,140 | $44,150 | $0 | $0 |
| 2022 | $756 | $44,150 | $10,000 | $34,150 |
| 2021 | $756 | $44,150 | $10,000 | $34,150 |
| 2020 | $558 | $44,150 | $10,000 | $34,150 |
| 2019 | $751 | $37,000 | $8,750 | $28,250 |
| 2018 | $773 | $37,000 | $8,750 | $28,250 |
| 2017 | $658 | $37,000 | $8,750 | $28,250 |
| 2016 | $677 | $35,575 | $8,750 | $26,825 |
| 2015 | $677 | $35,575 | $8,750 | $26,825 |
| 2014 | $677 | $35,575 | $8,750 | $26,825 |
Source: Public Records
Map
Nearby Homes
- 155 Countryside Dr
- 70 Country Forest Dr
- 75 Brookwood Cir
- 40 Gracie Cove
- 50 Sheraton Cove
- 265 Kipling Dr
- 250 Kipling Dr
- 195 Chickasaw Trace Dr
- 120 Blue St
- 215 Hughetta St S
- 30 Southampton St
- 95 Blue St
- 65 Blue St
- 175 Marrietta Dr
- 0 Mcfadden Dr Unit 10209515
- 24.17 AC Tennessee 194
- 225 Country Brook Dr
- 430 Marrietta Dr
- 260 Country Brook Dr
- 150 James Cove
- 180 Country Place
- 200 Country Place
- 145 Country Forrest Dr
- 170 Country Place
- 195 Country Place
- 205 Country Place
- 185 Country Place
- 160 Country Place
- 245 Country Place
- 60 Tall Forest Ln
- 215 Country Place
- 235 Country Place
- 125 Country Forrest Dr
- 165 Country Place
- 125 Country Forest Dr
- 145 Countryside Dr
- 225 Country Place
- 150 Country Place
- 150 Country Place
- 135 Countryside Dr