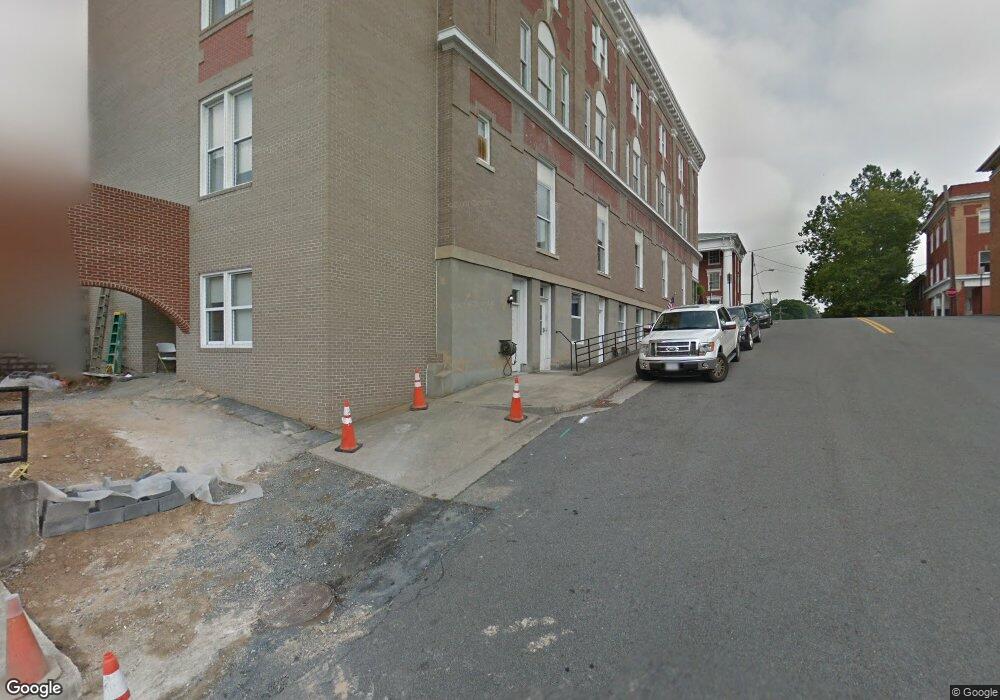
190 E Main St Abingdon, VA 24210
Estimated Value: $1,379,707
Studio
--
Bath
14,262
Sq Ft
$97/Sq Ft
Est. Value
About This Home
This home is located at 190 E Main St, Abingdon, VA 24210 and is currently estimated at $1,379,707, approximately $96 per square foot. 190 E Main St is a home located in Washington County with nearby schools including Abingdon Elementary School, E.B. Stanley Middle School, and Abingdon High School.
Ownership History
Date
Name
Owned For
Owner Type
Purchase Details
Closed on
Apr 18, 2023
Sold by
Bundy Matthew T and Bundy Alison B
Bought by
Hawking Holdings Llc
Current Estimated Value
Purchase Details
Closed on
Dec 15, 2022
Sold by
Bundy Matthew T
Bought by
Old Hemlock Properties Llc
Purchase Details
Closed on
Jul 17, 2017
Sold by
Bundy Matthew T and Bundy Alison B
Bought by
Boucher Harrington Anne and Boucher Frederick Carlyle
Purchase Details
Closed on
Aug 18, 2016
Sold by
Morefield Llc and Patterson Morefield Martha
Bought by
Bundy Matthew T and Bundy Alison B
Home Financials for this Owner
Home Financials are based on the most recent Mortgage that was taken out on this home.
Original Mortgage
$720,000
Interest Rate
3.41%
Mortgage Type
Construction
Create a Home Valuation Report for This Property
The Home Valuation Report is an in-depth analysis detailing your home's value as well as a comparison with similar homes in the area
Home Values in the Area
Average Home Value in this Area
Purchase History
| Date | Buyer | Sale Price | Title Company |
|---|---|---|---|
| Hawking Holdings Llc | -- | None Listed On Document | |
| Old Hemlock Properties Llc | -- | -- | |
| Boucher Harrington Anne | -- | None Available | |
| Bundy Matthew T | $800,000 | Attorney |
Source: Public Records
Mortgage History
| Date | Status | Borrower | Loan Amount |
|---|---|---|---|
| Previous Owner | Bundy Matthew T | $720,000 |
Source: Public Records
Tax History
| Year | Tax Paid | Tax Assessment Tax Assessment Total Assessment is a certain percentage of the fair market value that is determined by local assessors to be the total taxable value of land and additions on the property. | Land | Improvement |
|---|---|---|---|---|
| 2025 | $5,678 | $1,169,200 | $141,900 | $1,027,300 |
| 2024 | $57 | $946,300 | $113,500 | $832,800 |
| 2023 | $5,672 | $945,400 | $112,600 | $832,800 |
| 2022 | $5,672 | $945,400 | $112,600 | $832,800 |
| 2021 | $1,097 | $945,400 | $112,600 | $832,800 |
| 2019 | $5,632 | $893,900 | $112,600 | $781,300 |
| 2018 | $4,929 | $782,400 | $112,600 | $669,800 |
| 2017 | $4,929 | $782,400 | $112,600 | $669,800 |
| 2016 | $4,828 | $766,300 | $99,600 | $666,700 |
| 2015 | $4,828 | $766,300 | $99,600 | $666,700 |
| 2014 | $4,828 | $766,300 | $99,600 | $666,700 |
Source: Public Records
Map
Nearby Homes
- 303 E Main St
- 307 B St SE
- 263 Oak Hill St NE
- 344 Gibson St SE
- 224 Mason Place NW
- 335 Oak Hill St NE
- Lot 8 Homestead Way
- 343 White's Mill Rd
- 407 Summers St NE
- 323 Tailrace Dr
- 446 Montview Dr
- 302 Front St SW
- 0 Front St SW
- TBD Green Spring Rd
- 610 Thompson Dr
- TBD Cummings St
- 211 Butt St SW
- 0 Colonade Dr
- 524 Hagy St SW
- 625 Locust St NW
Your Personal Tour Guide
Ask me questions while you tour the home.