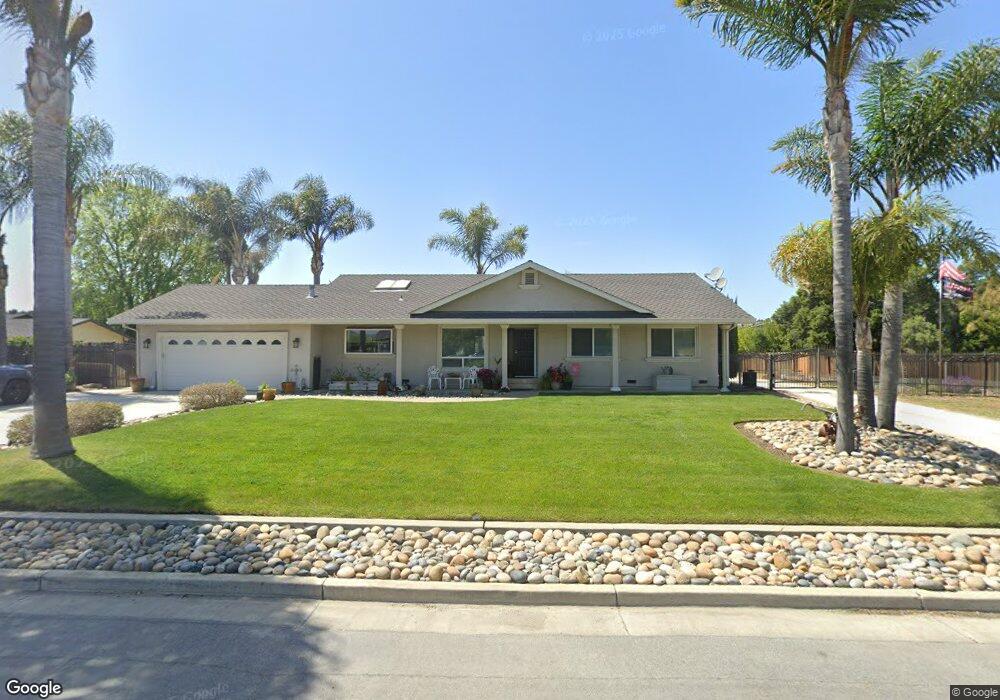
190 Holliday Dr Hollister, CA 95023
Estimated Value: $949,000 - $1,174,000
--
Bed
--
Bath
--
Sq Ft
0.92
Acres
About This Home
This home is located at 190 Holliday Dr, Hollister, CA 95023 and is currently estimated at $1,063,046. 190 Holliday Dr is a home located in San Benito County with nearby schools including Cerra Vista Elementary School, Rancho San Justo School, and San Benito High School.
Ownership History
Date
Name
Owned For
Owner Type
Purchase Details
Closed on
Nov 9, 2016
Sold by
Shaffer Douglas E and Shaffer Lynn A
Bought by
Shaffer Doug and Shaffer Lynn
Current Estimated Value
Purchase Details
Closed on
Mar 13, 2015
Sold by
Shaffer Doug and Shaffer Lynn
Bought by
Shaffer Douglas E and Shaffer Lynn A
Home Financials for this Owner
Home Financials are based on the most recent Mortgage that was taken out on this home.
Original Mortgage
$554,537
Outstanding Balance
$427,678
Interest Rate
3.87%
Mortgage Type
FHA
Estimated Equity
$635,368
Purchase Details
Closed on
Mar 21, 2000
Sold by
Perry Keith J and Perry Jeanne C
Bought by
Shaffer Douglas E and Shaffer Lynn A
Home Financials for this Owner
Home Financials are based on the most recent Mortgage that was taken out on this home.
Original Mortgage
$284,750
Interest Rate
8%
Create a Home Valuation Report for This Property
The Home Valuation Report is an in-depth analysis detailing your home's value as well as a comparison with similar homes in the area
Home Values in the Area
Average Home Value in this Area
Purchase History
| Date | Buyer | Sale Price | Title Company |
|---|---|---|---|
| Shaffer Doug | -- | Accommodation | |
| Shaffer Douglas E | -- | Old Republic Title Company | |
| Shaffer Living Trust | -- | None Available | |
| Shaffer Douglas E | $335,000 | Chicago Title Insurance |
Source: Public Records
Mortgage History
| Date | Status | Borrower | Loan Amount |
|---|---|---|---|
| Open | Shaffer Douglas E | $554,537 | |
| Closed | Shaffer Douglas E | $284,750 |
Source: Public Records
Tax History Compared to Growth
Tax History
| Year | Tax Paid | Tax Assessment Tax Assessment Total Assessment is a certain percentage of the fair market value that is determined by local assessors to be the total taxable value of land and additions on the property. | Land | Improvement |
|---|---|---|---|---|
| 2025 | $11,879 | $985,937 | $299,699 | $686,238 |
| 2023 | $11,879 | $947,654 | $288,062 | $659,592 |
| 2022 | $11,490 | $929,073 | $282,414 | $646,659 |
| 2021 | $11,334 | $910,857 | $276,877 | $633,980 |
| 2020 | $11,384 | $901,518 | $274,038 | $627,480 |
| 2019 | $11,058 | $883,842 | $268,665 | $615,177 |
| 2018 | $8,612 | $676,613 | $263,398 | $413,215 |
| 2017 | $8,498 | $663,347 | $258,234 | $405,113 |
| 2016 | $8,012 | $650,341 | $253,171 | $397,170 |
| 2015 | $7,402 | $593,794 | $249,369 | $344,425 |
| 2014 | $6,988 | $582,164 | $244,485 | $337,679 |
Source: Public Records
Map
Nearby Homes
- 2161 Teakwood Ct
- 1557 Santana Ranch Dr
- The Solana Plan at Santana Ranch - The Cottages
- The Carmel Plan at Santana Ranch - The Highlands
- The Capitola Plan at Santana Ranch - The Highlands
- The Ventura Plan at Santana Ranch - The Cottages
- The Huntington Plan at Santana Ranch - The Highlands
- The Big Sur Plan at Santana Ranch - The Highlands
- The Newport Plan at Santana Ranch - The Cottages
- The Pismo Plan at Santana Ranch - The Highlands
- The Monterey Plan at Santana Ranch - The Highlands
- 1618 Lily Ct
- 1549 Foxtail Ct
- 1251 Mulberry St
- 1610 Park Trail Dr
- 2071 Daisy Dr
- 2171 Spruce Dr
- Plan 1472 at Highgrove at Fairview
- Plan 2538 Modeled at Brighton at Fairview
- Plan 1960 at Highgrove at Fairview