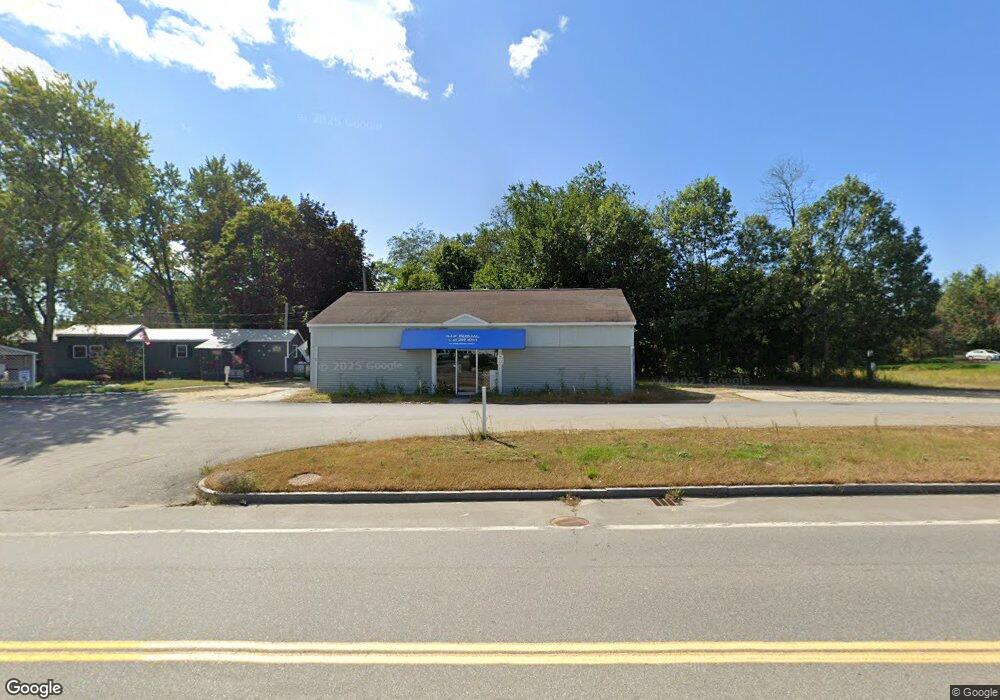
190 Manchester St Concord, NH 03301
Concord Heights NeighborhoodEstimated Value: $1,219,421
3
Beds
1
Bath
1,271
Sq Ft
$959/Sq Ft
Est. Value
About This Home
This home is located at 190 Manchester St, Concord, NH 03301 and is currently estimated at $1,219,421, approximately $959 per square foot. 190 Manchester St is a home located in Merrimack County with nearby schools including Broken Ground School, Rundlett Middle School, and Concord High School.
Ownership History
Date
Name
Owned For
Owner Type
Purchase Details
Closed on
Jun 8, 2021
Sold by
Thibeault Roland H
Bought by
Thibeault James J
Current Estimated Value
Purchase Details
Closed on
Jan 31, 2019
Sold by
S & M Props
Bought by
Top Of The Hill Coop
Purchase Details
Closed on
Nov 6, 2015
Sold by
Gloria A Alosa Ret
Bought by
Pasquale F Alosa Ret
Purchase Details
Closed on
Mar 5, 2010
Sold by
Duchrme Richard
Bought by
Chapman Sindee
Purchase Details
Closed on
Dec 4, 2009
Sold by
Davis Keith A
Bought by
Gagnon Harry
Purchase Details
Closed on
Aug 18, 2009
Sold by
Archibald Gary J
Bought by
Pendergast John
Home Financials for this Owner
Home Financials are based on the most recent Mortgage that was taken out on this home.
Original Mortgage
$17,000
Interest Rate
5.36%
Mortgage Type
Commercial
Purchase Details
Closed on
Jan 21, 2009
Sold by
Runci Robert M and Runci Kathleen E
Bought by
Lord Linda E
Purchase Details
Closed on
Dec 30, 1997
Sold by
Emery Albert
Bought by
Lord Linda
Create a Home Valuation Report for This Property
The Home Valuation Report is an in-depth analysis detailing your home's value as well as a comparison with similar homes in the area
Home Values in the Area
Average Home Value in this Area
Purchase History
| Date | Buyer | Sale Price | Title Company |
|---|---|---|---|
| Thibeault James J | -- | None Available | |
| Top Of The Hill Coop | $630,000 | -- | |
| Pasquale F Alosa Ret | -- | -- | |
| Chapman Sindee | $15,000 | -- | |
| Gagnon Harry | $2,700 | -- | |
| Pendergast John | $20,000 | -- | |
| Lord Linda E | $12,500 | -- | |
| Lord Linda | $9,200 | -- |
Source: Public Records
Mortgage History
| Date | Status | Borrower | Loan Amount |
|---|---|---|---|
| Previous Owner | Lord Linda | $17,000 |
Source: Public Records
Tax History Compared to Growth
Tax History
| Year | Tax Paid | Tax Assessment Tax Assessment Total Assessment is a certain percentage of the fair market value that is determined by local assessors to be the total taxable value of land and additions on the property. | Land | Improvement |
|---|---|---|---|---|
| 2024 | $16,849 | $608,500 | $412,900 | $195,600 |
| 2023 | $16,344 | $608,500 | $412,900 | $195,600 |
| 2022 | $15,754 | $608,500 | $412,900 | $195,600 |
| 2021 | $15,286 | $608,500 | $412,900 | $195,600 |
| 2020 | $16,013 | $598,400 | $412,900 | $185,500 |
| 2019 | $16,899 | $608,300 | $412,900 | $195,400 |
| 2018 | $2,103 | $608,300 | $412,900 | $195,400 |
| 2017 | $16,967 | $600,800 | $405,400 | $195,400 |
| 2016 | $16,685 | $603,000 | $405,400 | $197,600 |
| 2015 | $16,532 | $604,700 | $405,400 | $199,300 |
| 2014 | $16,212 | $604,700 | $405,400 | $199,300 |
| 2013 | $15,519 | $606,700 | $405,400 | $201,300 |
| 2012 | $17,217 | $706,500 | $525,200 | $181,300 |
Source: Public Records
Map
Nearby Homes
- 82 Sheep Davis Rd
- 33 Mulberry St Unit 2
- 78 Fairfield Dr
- 0 Garvins Falls Rd Unit 4 5061370
- 15 Bridle Path Trail
- 5 Highridge Trail
- 562 Third Range Rd Unit A/B
- 44 Hazel Dr
- 41 Longmeadow Dr
- 492 Woodlawn Ridge Rd
- 6 Lawrence Street Extension
- 516 Hall St
- 340 Brickett Hill Rd
- 91 Whittemore Rd
- 344 Brickett Hill Rd Unit 2
- 348 Brickett Hill Rd Unit 3
- 376 S Main St
- 455 Carrie Ave
- 105 S Main St
- 24 Badger St
- 9 Broken Bridge Rd
- 192 Manchester St
- 5 Integra Dr
- 192 Manchester St
- 163 Manchester St
- 163 Manchester St Unit 3
- 163 Manchester St Unit 2/3
- 163 Manchester St Unit 5
- 163 Manchester Street - Ste D (#2)
- 163 Manchester Street - Ste D (#1)
- 8 Integra Dr
- 240 Airport Rd Unit A/B
- 64 Old Suncook Rd
- 239 Airport Rd
- 153 Manchester St
- 153 Manchester St Unit 11
- 237 Airport Rd
- 56 Old Suncook Rd
- 56 Old Suncook Rd Unit 3
- 56 Old Suncook Rd Unit 1,2