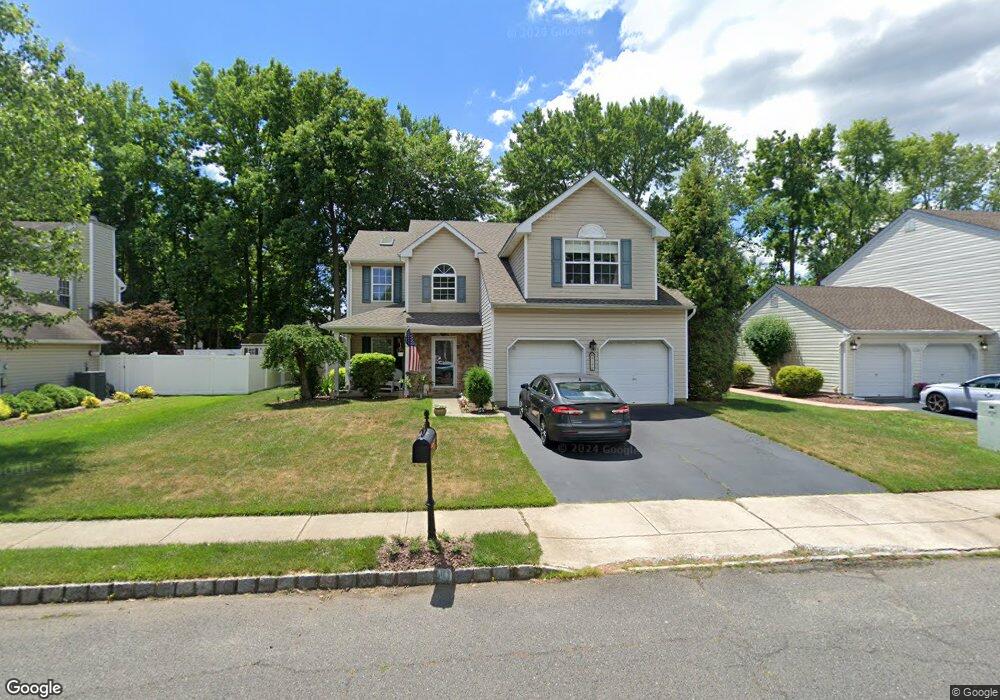
190 Navajo Dr Matawan, NJ 07747
Estimated Value: $763,000 - $858,000
4
Beds
2
Baths
2,320
Sq Ft
$351/Sq Ft
Est. Value
About This Home
This home is located at 190 Navajo Dr, Matawan, NJ 07747 and is currently estimated at $813,680, approximately $350 per square foot. 190 Navajo Dr is a home located in Monmouth County with nearby schools including Matawan Reg High School, St. Joseph Elementary School, and Icob Academy.
Ownership History
Date
Name
Owned For
Owner Type
Purchase Details
Closed on
Jul 23, 2004
Sold by
Chee Benny
Bought by
Eubner Johnt and Teubner Barbara
Current Estimated Value
Home Financials for this Owner
Home Financials are based on the most recent Mortgage that was taken out on this home.
Original Mortgage
$300,000
Outstanding Balance
$149,679
Interest Rate
6.2%
Estimated Equity
$664,001
Purchase Details
Closed on
Aug 30, 1996
Sold by
Ahb At Aberdeen
Bought by
Chase Benny and Chee Kathleen
Home Financials for this Owner
Home Financials are based on the most recent Mortgage that was taken out on this home.
Original Mortgage
$189,000
Interest Rate
7.9%
Create a Home Valuation Report for This Property
The Home Valuation Report is an in-depth analysis detailing your home's value as well as a comparison with similar homes in the area
Home Values in the Area
Average Home Value in this Area
Purchase History
| Date | Buyer | Sale Price | Title Company |
|---|---|---|---|
| Eubner Johnt | $415,000 | -- | |
| Chase Benny | $210,000 | -- |
Source: Public Records
Mortgage History
| Date | Status | Borrower | Loan Amount |
|---|---|---|---|
| Open | Eubner Johnt | $300,000 | |
| Previous Owner | Chase Benny | $189,000 |
Source: Public Records
Tax History Compared to Growth
Tax History
| Year | Tax Paid | Tax Assessment Tax Assessment Total Assessment is a certain percentage of the fair market value that is determined by local assessors to be the total taxable value of land and additions on the property. | Land | Improvement |
|---|---|---|---|---|
| 2025 | $14,230 | $740,700 | $406,000 | $334,700 |
| 2024 | $14,731 | $704,100 | $375,500 | $328,600 |
| 2023 | $14,731 | $688,700 | $367,800 | $320,900 |
| 2022 | $13,274 | $489,600 | $160,500 | $329,100 |
| 2021 | $13,274 | $491,100 | $198,400 | $292,700 |
| 2020 | $12,932 | $476,500 | $190,400 | $286,100 |
| 2019 | $13,238 | $473,800 | $189,400 | $284,400 |
| 2018 | $12,670 | $454,600 | $183,400 | $271,200 |
| 2017 | $12,492 | $454,600 | $193,400 | $261,200 |
| 2016 | $11,691 | $444,000 | $186,400 | $257,600 |
| 2015 | $11,548 | $421,000 | $146,400 | $274,600 |
| 2014 | $12,083 | $449,200 | $176,400 | $272,800 |
Source: Public Records
Map
Nearby Homes
- 40 North Cir
- 70 Northland Ln
- 557 Lloyd Rd Unit B
- 14 Dolan Ave
- 7 Lucia Ct Unit 7
- 570 Line Rd
- 23 Mathiasen Place
- 154 Lower Main St
- 46 Parkview Dr
- 22 Lower Main St
- 362 Broadway
- 30 Briscoe Terrace
- 324 Maple Place
- 279 Washington St
- 9 Tralee Rd
- 32 Lake Blvd
- 160 Village Green Way
- 47 Village Green Way
- 101 Broad St
- 3 Avondale Ln