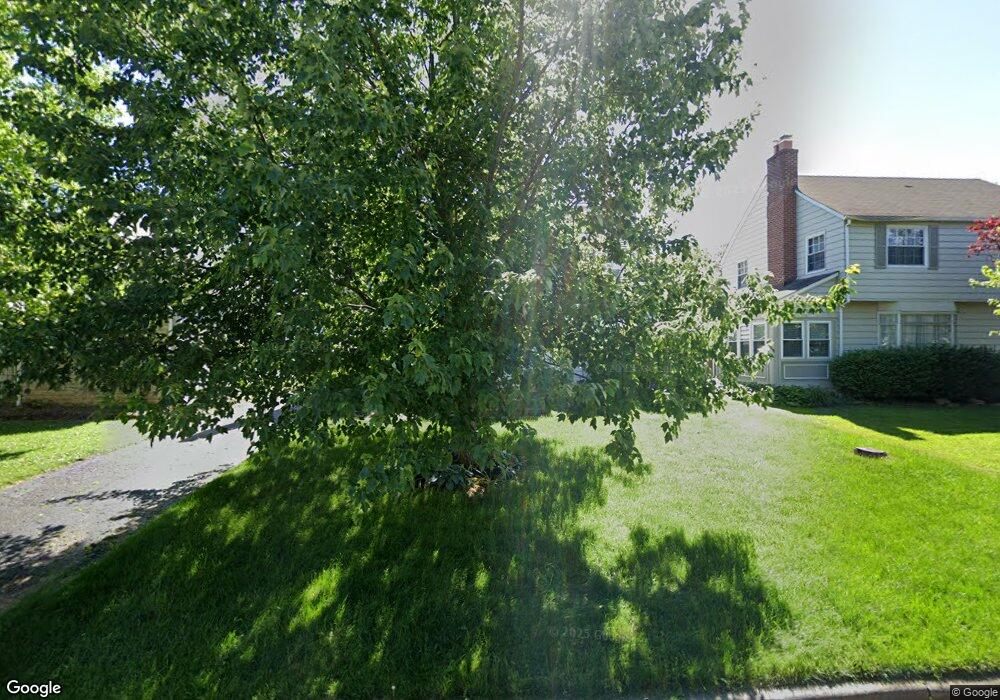
190 S Algonquin Ave Columbus, OH 43204
Westgate NeighborhoodEstimated Value: $270,122 - $331,000
3
Beds
2
Baths
1,541
Sq Ft
$197/Sq Ft
Est. Value
About This Home
This home is located at 190 S Algonquin Ave, Columbus, OH 43204 and is currently estimated at $303,781, approximately $197 per square foot. 190 S Algonquin Ave is a home located in Franklin County with nearby schools including Westgate Alternative Elementary School, Westmoor Middle School, and West High School.
Ownership History
Date
Name
Owned For
Owner Type
Purchase Details
Closed on
Sep 30, 2005
Sold by
Tucker Walter K
Bought by
Eubanks Richard H
Current Estimated Value
Home Financials for this Owner
Home Financials are based on the most recent Mortgage that was taken out on this home.
Original Mortgage
$70,000
Outstanding Balance
$37,750
Interest Rate
5.88%
Mortgage Type
Fannie Mae Freddie Mac
Estimated Equity
$266,031
Purchase Details
Closed on
May 16, 2002
Sold by
Clyburn Harold E and Clyburn Linda L
Bought by
Tucker Walter K
Home Financials for this Owner
Home Financials are based on the most recent Mortgage that was taken out on this home.
Original Mortgage
$122,050
Interest Rate
7%
Mortgage Type
Purchase Money Mortgage
Purchase Details
Closed on
May 28, 1968
Bought by
Clyburn Harold E
Create a Home Valuation Report for This Property
The Home Valuation Report is an in-depth analysis detailing your home's value as well as a comparison with similar homes in the area
Home Values in the Area
Average Home Value in this Area
Purchase History
| Date | Buyer | Sale Price | Title Company |
|---|---|---|---|
| Eubanks Richard H | $148,800 | Independent | |
| Tucker Walter K | $128,500 | Chicago Title | |
| Clyburn Harold E | -- | -- |
Source: Public Records
Mortgage History
| Date | Status | Borrower | Loan Amount |
|---|---|---|---|
| Open | Eubanks Richard H | $70,000 | |
| Previous Owner | Tucker Walter K | $122,050 |
Source: Public Records
Tax History Compared to Growth
Tax History
| Year | Tax Paid | Tax Assessment Tax Assessment Total Assessment is a certain percentage of the fair market value that is determined by local assessors to be the total taxable value of land and additions on the property. | Land | Improvement |
|---|---|---|---|---|
| 2024 | $3,712 | $82,710 | $21,630 | $61,080 |
| 2023 | $3,665 | $82,705 | $21,630 | $61,075 |
| 2022 | $2,763 | $53,280 | $8,160 | $45,120 |
| 2021 | $2,768 | $53,280 | $8,160 | $45,120 |
| 2020 | $2,772 | $53,280 | $8,160 | $45,120 |
| 2019 | $2,678 | $44,140 | $6,790 | $37,350 |
| 2018 | $2,507 | $44,140 | $6,790 | $37,350 |
| 2017 | $2,676 | $44,140 | $6,790 | $37,350 |
| 2016 | $2,579 | $38,930 | $7,740 | $31,190 |
| 2015 | $2,341 | $38,930 | $7,740 | $31,190 |
| 2014 | $2,347 | $38,930 | $7,740 | $31,190 |
| 2013 | $1,219 | $40,985 | $8,155 | $32,830 |
Source: Public Records
Map
Nearby Homes
- 253 Powhatan Ave
- 195 S Sylvan Ave
- 0 S Brinker Ave
- 133 S Brinker Ave
- 267 S Westgate Ave
- 328 S Southampton Ave
- 79 S Southampton Ave
- 3096 Ellis Place
- 43 Letchworth Ave
- 30 Demorest Rd
- 32 Orel Ave
- 36-38 Orel Ave
- 58 Binns Blvd
- 66 N Brinker Ave
- 3276-3278 Sullivant Ave
- 3300-3302 Sullivant Ave
- 261 S Chase Ave
- 75 N Huron Ave
- 113 N Brinker Ave Unit 115
- 457 Guernsey Ave
- 182 S Algonquin Ave
- 196 S Algonquin Ave
- 176 S Algonquin Ave
- 202 S Algonquin Ave
- 187 S Brinker Ave
- 193 S Brinker Ave
- 181 S Brinker Ave
- 170 S Algonquin Ave
- 208 S Algonquin Ave
- 199 S Brinker Ave
- 175 S Brinker Ave
- 189 S Algonquin Ave
- 203 S Brinker Ave
- 181 S Algonquin Ave
- 195 S Algonquin Ave
- 175 S Algonquin Ave
- 201 S Algonquin Ave
- 164 S Algonquin Ave
- 216 S Algonquin Ave
- 209 S Brinker Ave