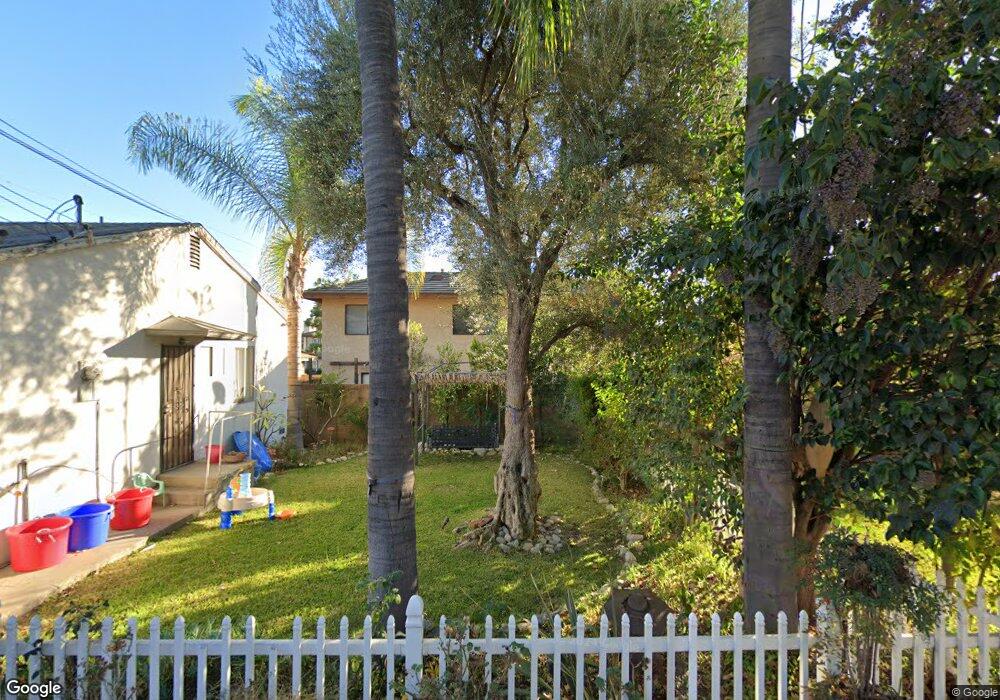
190 S Walnut Grove Ave Unit F San Gabriel, CA 91776
Estimated Value: $628,000 - $985,000
3
Beds
2
Baths
1,717
Sq Ft
$495/Sq Ft
Est. Value
About This Home
This home is located at 190 S Walnut Grove Ave Unit F, San Gabriel, CA 91776 and is currently estimated at $850,415, approximately $495 per square foot. 190 S Walnut Grove Ave Unit F is a home located in Los Angeles County with nearby schools including Roosevelt Elementary School, Jefferson Middle School, and Gabrielino High School.
Ownership History
Date
Name
Owned For
Owner Type
Purchase Details
Closed on
Jan 29, 2015
Sold by
Ip Jimmy O and Ip Emily Y
Bought by
Jimmy & Emily Ip 2007 Living Trust
Current Estimated Value
Purchase Details
Closed on
Aug 10, 2009
Sold by
Hsueh Shung Shing
Bought by
Ip Jimmy O and Ip Emily Y
Purchase Details
Closed on
Sep 16, 1997
Sold by
Shieh Grace Sau Yee
Bought by
Shieh Grace Sau Yee and Grace Sau Yee Shieh Separate P
Purchase Details
Closed on
Jan 31, 1996
Sold by
Security Pacific National Bank
Bought by
Shieh Grace Sau Yee and Hsueh Shung Shing
Purchase Details
Closed on
Jan 19, 1996
Sold by
Shieh Edwin Wen Yueon
Bought by
Shieh Grace Sau Yee
Purchase Details
Closed on
Jan 3, 1996
Sold by
California Federal Bank Fsb
Bought by
Shieh Grace Sau Yee and Hsueh Shung Shing
Purchase Details
Closed on
Jun 23, 1995
Sold by
Cho Sung H and Cho Young D K
Bought by
Security Pacific National Bank
Create a Home Valuation Report for This Property
The Home Valuation Report is an in-depth analysis detailing your home's value as well as a comparison with similar homes in the area
Home Values in the Area
Average Home Value in this Area
Purchase History
| Date | Buyer | Sale Price | Title Company |
|---|---|---|---|
| Jimmy & Emily Ip 2007 Living Trust | -- | None Available | |
| Ip Jimmy O | -- | None Available | |
| Ip Jimmy O | $230,000 | Fidelity National Title | |
| Shieh Grace Sau Yee | -- | -- | |
| Shieh Grace Sau Yee | $186,000 | First American | |
| Shieh Grace Sau Yee | -- | First American Title Co | |
| Shieh Grace Sau Yee | $186,000 | First American Title Co | |
| Security Pacific National Bank | $148,760 | Continental Lawyers Title Co |
Source: Public Records
Tax History Compared to Growth
Tax History
| Year | Tax Paid | Tax Assessment Tax Assessment Total Assessment is a certain percentage of the fair market value that is determined by local assessors to be the total taxable value of land and additions on the property. | Land | Improvement |
|---|---|---|---|---|
| 2025 | $6,246 | $449,855 | $195,903 | $253,952 |
| 2024 | $6,246 | $441,035 | $192,062 | $248,973 |
| 2023 | $6,137 | $432,389 | $188,297 | $244,092 |
| 2022 | $5,888 | $423,911 | $184,605 | $239,306 |
| 2021 | $5,840 | $415,600 | $180,986 | $234,614 |
| 2019 | $5,591 | $403,275 | $175,619 | $227,656 |
| 2018 | $5,507 | $395,369 | $172,176 | $223,193 |
| 2016 | $5,238 | $380,018 | $165,491 | $214,527 |
| 2015 | $5,200 | $374,311 | $163,006 | $211,305 |
| 2014 | $5,214 | $366,979 | $159,813 | $207,166 |
Source: Public Records
Map
Nearby Homes
- 1120 E Las Tunas Dr Unit 2
- 1230 Elm Ave Unit G
- 5613 N Charlotte Ave
- 5716 N Charlotte Ave
- 1349 Elm Ave
- 8313 Frandsen St
- 8413 Seth St
- 6013 N Walnut Grove Ave
- 620 S Gladys Ave Unit D
- 818 Santa fe Ave Unit F
- 831 E Leslie Dr
- 600 E Broadway
- 5619 Sultana Ave Unit A
- 5241 Rosemead Blvd Unit B
- 8739 E Sienna Ln
- 713 Sunset Ave
- 5463 Sultana Ave
- 345 N San Gabriel Blvd
- 420 E Las Tunas Dr Unit 3C
- 0 Sultana Ave
- 190 S Walnut Grove Ave Unit E
- 190 S Walnut Grove Ave Unit D
- 190 S Walnut Grove Ave Unit C
- 190 S Walnut Grove Ave Unit B
- 190 S Walnut Grove Ave Unit A
- 5570 Walnut Grove Ave Unit E
- 5570 Walnut Grove Ave
- 5570 Walnut Grove Ave Unit G
- 5570 Walnut Grove Ave Unit F
- 5570 Walnut Grove Ave Unit D
- 5570 Walnut Grove Ave Unit C
- 5570 Walnut Grove Ave Unit B
- 5570 Walnut Grove Ave Unit A
- 5600 Walnut Grove Ave Unit F
- 5600 Walnut Grove Ave Unit E
- 5600 Walnut Grove Ave Unit D
- 5600 Walnut Grove Ave Unit C
- 5600 Walnut Grove Ave Unit B
- 5600 Walnut Grove Ave Unit A
- 5600 Walnut Grove Ave Unit G