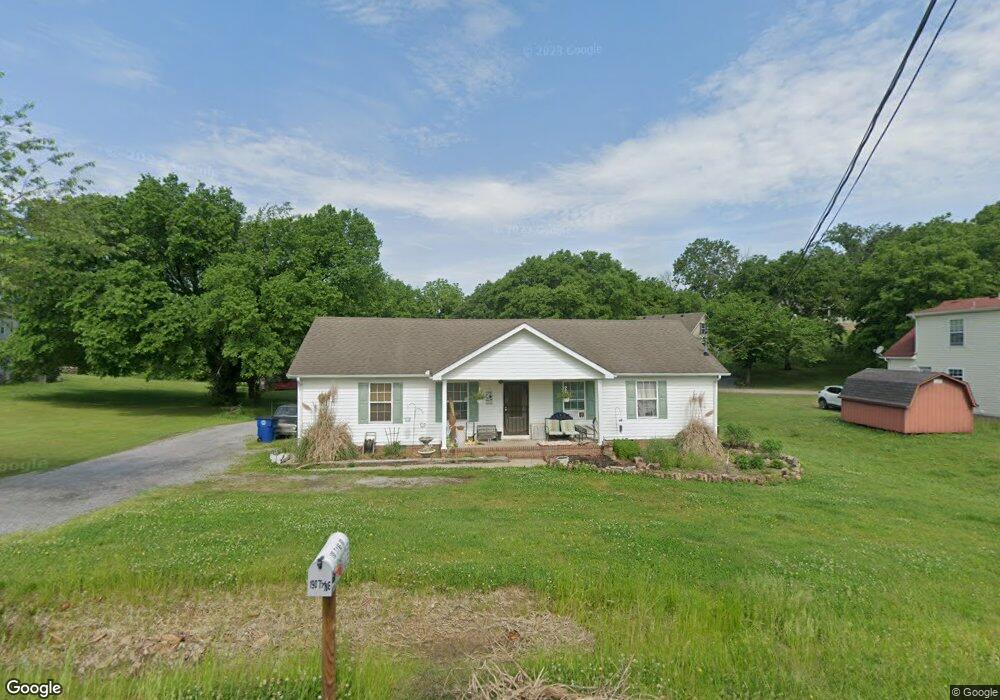
190 Tyne Rd Shelbyville, TN 37160
Estimated Value: $273,000 - $369,000
--
Bed
2
Baths
1,404
Sq Ft
$226/Sq Ft
Est. Value
About This Home
This home is located at 190 Tyne Rd, Shelbyville, TN 37160 and is currently estimated at $316,723, approximately $225 per square foot. 190 Tyne Rd is a home located in Bedford County with nearby schools including South Side Elementary School, Harris Middle School, and Christian Chapel Academy.
Ownership History
Date
Name
Owned For
Owner Type
Purchase Details
Closed on
Mar 16, 2004
Sold by
Reed Arthur Thomas
Bought by
Reed Jessa Louise
Current Estimated Value
Purchase Details
Closed on
Sep 21, 1999
Sold by
Gambill Gale
Bought by
Timberline Cove Investment
Purchase Details
Closed on
Jun 3, 1996
Sold by
Gambill Gale
Bought by
Mcreynolds W D Sally
Purchase Details
Closed on
Sep 29, 1994
Sold by
Stiles Richard F
Bought by
Barnes Fred and Barnes Teresa
Purchase Details
Closed on
Apr 29, 1994
Sold by
Parker Bobby L
Bought by
Claxton David and Claxton Stacey
Purchase Details
Closed on
Apr 8, 1994
Sold by
Parker Bobby L
Bought by
Stiles Richard F
Purchase Details
Closed on
Apr 7, 1994
Sold by
Stiles Richard F
Bought by
Parker Bobby L
Purchase Details
Closed on
Jun 6, 1990
Bought by
Gambill Gale
Purchase Details
Closed on
Sep 12, 1988
Bought by
Peels John L and Annie Mai
Purchase Details
Closed on
Dec 9, 1986
Bought by
Peels John L and Annie Mai
Create a Home Valuation Report for This Property
The Home Valuation Report is an in-depth analysis detailing your home's value as well as a comparison with similar homes in the area
Home Values in the Area
Average Home Value in this Area
Purchase History
| Date | Buyer | Sale Price | Title Company |
|---|---|---|---|
| Reed Jessa Louise | -- | -- | |
| Timberline Cove Investment | $10,000 | -- | |
| Mcreynolds W D Sally | $450 | -- | |
| Barnes Fred | -- | -- | |
| Claxton David | -- | -- | |
| Stiles Richard F | -- | -- | |
| Parker Bobby L | -- | -- | |
| Gambill Gale | $55,000 | -- | |
| Peels John L | $69,800 | -- | |
| Peels John L | -- | -- |
Source: Public Records
Tax History Compared to Growth
Tax History
| Year | Tax Paid | Tax Assessment Tax Assessment Total Assessment is a certain percentage of the fair market value that is determined by local assessors to be the total taxable value of land and additions on the property. | Land | Improvement |
|---|---|---|---|---|
| 2025 | -- | $54,600 | $0 | $0 |
| 2024 | -- | $54,600 | $23,125 | $31,475 |
| 2023 | $2,078 | $54,600 | $23,125 | $31,475 |
| 2022 | $2,138 | $54,600 | $23,125 | $31,475 |
| 2021 | $1,941 | $54,600 | $23,125 | $31,475 |
| 2020 | $1,358 | $54,600 | $23,125 | $31,475 |
| 2019 | $1,358 | $30,650 | $9,450 | $21,200 |
| 2018 | $1,328 | $30,650 | $9,450 | $21,200 |
| 2017 | $1,328 | $30,650 | $9,450 | $21,200 |
| 2016 | $1,315 | $30,650 | $9,450 | $21,200 |
| 2015 | $1,315 | $30,650 | $9,450 | $21,200 |
| 2014 | $1,179 | $30,083 | $0 | $0 |
Source: Public Records
Map
Nearby Homes