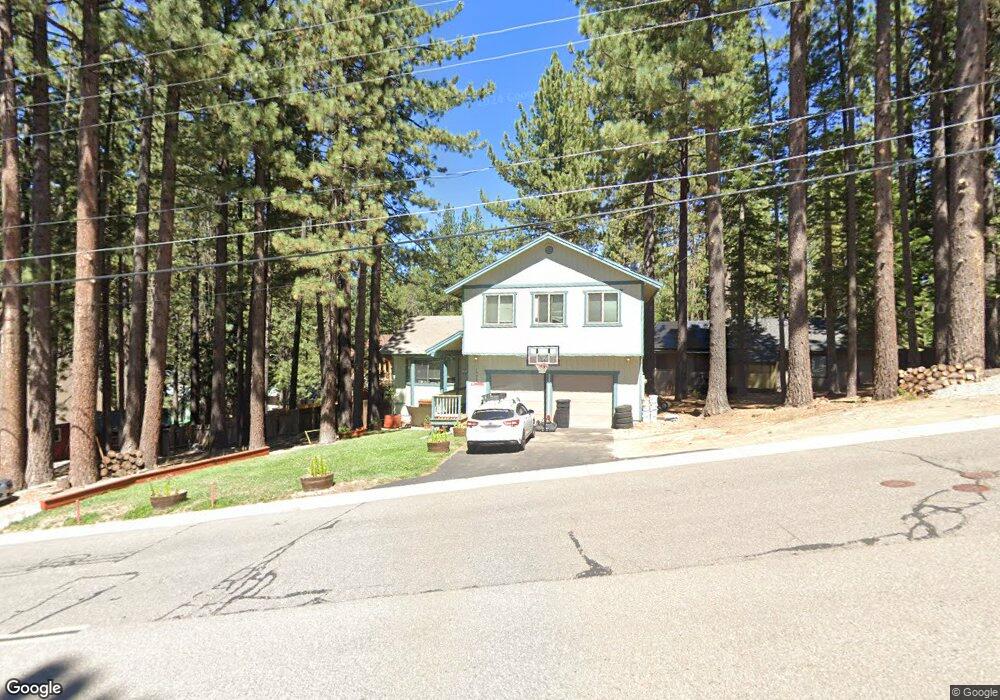
1900 Apache Ave South Lake Tahoe, CA 96150
Estimated Value: $649,690 - $758,000
3
Beds
2
Baths
1,722
Sq Ft
$407/Sq Ft
Est. Value
About This Home
This home is located at 1900 Apache Ave, South Lake Tahoe, CA 96150 and is currently estimated at $701,423, approximately $407 per square foot. 1900 Apache Ave is a home located in El Dorado County with nearby schools including Sierra House Elementary School, South Tahoe Middle School, and South Tahoe High School.
Ownership History
Date
Name
Owned For
Owner Type
Purchase Details
Closed on
Oct 14, 2021
Sold by
Goedhart Nancy A
Bought by
Goedhart Nancy A and Nancy A Goedhart Trust
Current Estimated Value
Purchase Details
Closed on
Jun 8, 2016
Sold by
Borge Timothy F and Goedhart Nancy A
Bought by
Goedhart Nancy A
Home Financials for this Owner
Home Financials are based on the most recent Mortgage that was taken out on this home.
Original Mortgage
$187,050
Interest Rate
3.66%
Mortgage Type
New Conventional
Purchase Details
Closed on
May 12, 2015
Sold by
Borge Timothy F
Bought by
Borge Timothy F and Goedhart Nancy
Purchase Details
Closed on
Dec 28, 2000
Sold by
Borge Linda S
Bought by
Borge Timothy F
Home Financials for this Owner
Home Financials are based on the most recent Mortgage that was taken out on this home.
Original Mortgage
$199,000
Interest Rate
7.65%
Create a Home Valuation Report for This Property
The Home Valuation Report is an in-depth analysis detailing your home's value as well as a comparison with similar homes in the area
Home Values in the Area
Average Home Value in this Area
Purchase History
We collect this data history from publicly available records. To have your information removed, we recommend requesting removal directly through your county’s website.
| Date | Buyer | Sale Price | Title Company |
|---|---|---|---|
| Goedhart Nancy A | -- | None Available | |
| Goedhart Nancy A | -- | Lawyers Title | |
| Borge Timothy F | -- | None Available | |
| Borge Timothy F | -- | Fidelity National Title Co |
Source: Public Records
Mortgage History
We collect this data history from publicly available records. To have your information removed, we recommend requesting removal directly through your county’s website.
| Date | Status | Borrower | Loan Amount |
|---|---|---|---|
| Closed | Goedhart Nancy A | $187,050 | |
| Closed | Borge Timothy F | $199,000 |
Source: Public Records
Tax History
| Year | Tax Paid | Tax Assessment Tax Assessment Total Assessment is a certain percentage of the fair market value that is determined by local assessors to be the total taxable value of land and additions on the property. | Land | Improvement |
|---|---|---|---|---|
| 2025 | $3,190 | $295,699 | $50,968 | $244,731 |
| 2024 | $3,190 | $289,902 | $49,969 | $239,933 |
| 2023 | $3,135 | $284,219 | $48,990 | $235,229 |
| 2022 | $3,105 | $278,647 | $48,030 | $230,617 |
| 2021 | $3,055 | $273,185 | $47,089 | $226,096 |
| 2020 | $3,014 | $270,385 | $46,607 | $223,778 |
| 2019 | $3,000 | $265,085 | $45,694 | $219,391 |
| 2018 | $2,934 | $259,889 | $44,799 | $215,090 |
| 2017 | $2,889 | $254,794 | $43,921 | $210,873 |
| 2016 | $2,755 | $249,799 | $43,060 | $206,739 |
| 2015 | $2,725 | $246,049 | $42,414 | $203,635 |
| 2014 | $2,615 | $241,232 | $41,584 | $199,648 |
Source: Public Records
Map
Nearby Homes
- 1912 Apache Ave
- 1935 Apache Ave
- 2877 Us Highway 50
- 1798 Narragansett Cir
- 1911 Bella Coola Dr
- 1458 Apache Ave
- 1444 Apache Ave
- 2013 Piute St
- 1752 Southern Pines Dr
- 1986 Cherokee St
- 1344 Ottawa Dr
- 2113 Mandan St
- 1982 Cherokee St
- 1442 Vanderhoof Rd
- 1431 Vanderhoof Rd
- 1991 Washoe St
- 1724 Mohican Dr
- 1593 Plumas Cir
- 0 Tomahawk Ln
- 1534 Miztec St
- 1901 Blackfoot Rd
- 1891 Blackfoot Rd
- 1909 Blackfoot Rd
- 1901 Apache Ave
- 1902 Blackfoot Rd
- 1911 Apache Ave
- 1884 Blackfoot Rd
- 1889 Apache Ave
- 1915 Blackfoot Rd
- 1903 Mohican Dr
- 1919 Apache Ave
- 1914 Blackfoot Rd
- 1901 Celio Ln
- 1923 Apache Ave
- 1873 Celio Ln
- 1921 Blackfoot Rd
- 1877 Apache Ave
- 1940 Apache Ave
- 1907 Celio Ln
- 1874 Apache Ave
Your Personal Tour Guide
Ask me questions while you tour the home.