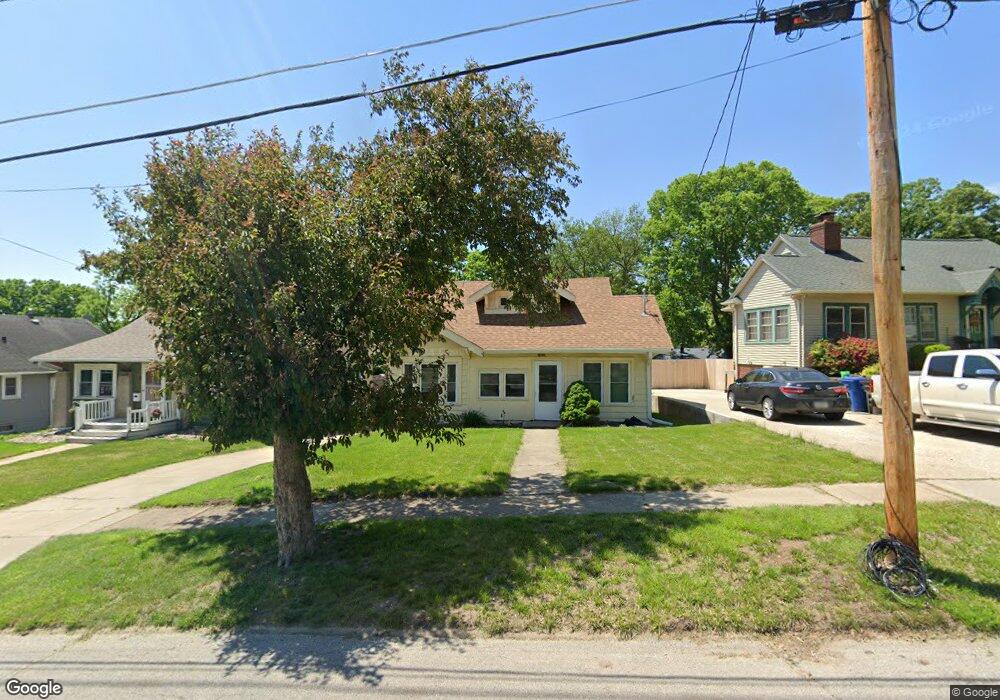
1900 E 32nd Ct Des Moines, IA 50317
Accent NeighborhoodEstimated Value: $172,884 - $196,000
3
Beds
1
Bath
1,198
Sq Ft
$151/Sq Ft
Est. Value
About This Home
This home is located at 1900 E 32nd Ct, Des Moines, IA 50317 and is currently estimated at $180,971, approximately $151 per square foot. 1900 E 32nd Ct is a home located in Polk County with nearby schools including Stowe Elementary School, Goodrell Middle School, and East High School.
Ownership History
Date
Name
Owned For
Owner Type
Purchase Details
Closed on
Aug 27, 2009
Sold by
Simon Kevin M and Simon Sheila
Bought by
Hoversten Richard L
Current Estimated Value
Home Financials for this Owner
Home Financials are based on the most recent Mortgage that was taken out on this home.
Original Mortgage
$87,028
Outstanding Balance
$56,743
Interest Rate
5.21%
Mortgage Type
Stand Alone First
Estimated Equity
$124,228
Purchase Details
Closed on
Sep 30, 2002
Sold by
Sellers Amanda E
Bought by
Simon Kevin M
Purchase Details
Closed on
Oct 25, 2001
Sold by
Dephillips Peter J and Dephillips Karen J
Bought by
Simon Kevin M and Sellers Amanda E
Home Financials for this Owner
Home Financials are based on the most recent Mortgage that was taken out on this home.
Original Mortgage
$85,901
Interest Rate
6.88%
Mortgage Type
FHA
Create a Home Valuation Report for This Property
The Home Valuation Report is an in-depth analysis detailing your home's value as well as a comparison with similar homes in the area
Home Values in the Area
Average Home Value in this Area
Purchase History
| Date | Buyer | Sale Price | Title Company |
|---|---|---|---|
| Hoversten Richard L | $95,000 | Itc | |
| Simon Kevin M | -- | -- | |
| Simon Kevin M | $87,000 | -- |
Source: Public Records
Mortgage History
| Date | Status | Borrower | Loan Amount |
|---|---|---|---|
| Open | Hoversten Richard L | $87,028 | |
| Previous Owner | Simon Kevin M | $85,901 |
Source: Public Records
Tax History
| Year | Tax Paid | Tax Assessment Tax Assessment Total Assessment is a certain percentage of the fair market value that is determined by local assessors to be the total taxable value of land and additions on the property. | Land | Improvement |
|---|---|---|---|---|
| 2025 | $2,256 | $162,700 | $29,300 | $133,400 |
| 2024 | $2,256 | $140,800 | $25,200 | $115,600 |
| 2023 | $2,364 | $140,800 | $25,200 | $115,600 |
| 2022 | $2,344 | $112,600 | $21,200 | $91,400 |
| 2021 | $2,394 | $112,600 | $21,200 | $91,400 |
| 2020 | $2,480 | $107,800 | $20,400 | $87,400 |
| 2019 | $2,350 | $107,800 | $20,400 | $87,400 |
| 2018 | $2,318 | $99,200 | $18,500 | $80,700 |
| 2017 | $2,134 | $99,200 | $18,500 | $80,700 |
| 2016 | $2,072 | $90,700 | $16,800 | $73,900 |
| 2015 | $2,072 | $90,700 | $16,800 | $73,900 |
| 2014 | $2,088 | $90,600 | $16,600 | $74,000 |
Source: Public Records
Map
Nearby Homes
- 2004 E 33rd St
- 1606 E 32nd St
- 1813 Larnard Dr
- 3400 Thompson Ave
- 1924 E 29th St
- 2924 Kinsey Ave
- 1604 E 29th St
- 3504 Easton Blvd
- 2757 Easton Blvd
- 1337 E 33rd St
- Parcel 05002945000000 St
- Parcel 05002944000000 St
- Parcel 05002943000000 St
- 3253 Dubuque Ave
- 2912 Cleveland Ave
- 2741 E Washington Ave
- 2812 Cleveland Ave
- 3403 Dubuque Ave
- 1315 E 33rd Ct
- 2744 Indianapolis Ave
- 1826 E 32nd Ct
- 1904 E 32nd Ct
- 1820 E 32nd Ct
- 1910 E 32nd Ct
- 1901 E 32nd St
- 1825 E 32nd St
- 1812 E 32nd Ct
- 1913 E 32nd St
- 1821 E 32nd St
- 1901 E 32nd Ct
- 1825 E 32nd Ct
- 1905 E 32nd Ct
- 1817 E 32nd St
- 1810 E 32nd Ct
- 1907 E 32nd Ct
- 1821 E 32nd Ct
- 1911 E 32nd Ct
- 3209 Easton Blvd
- 1817 E 32nd Ct
- 1813 E 32nd St
Your Personal Tour Guide
Ask me questions while you tour the home.