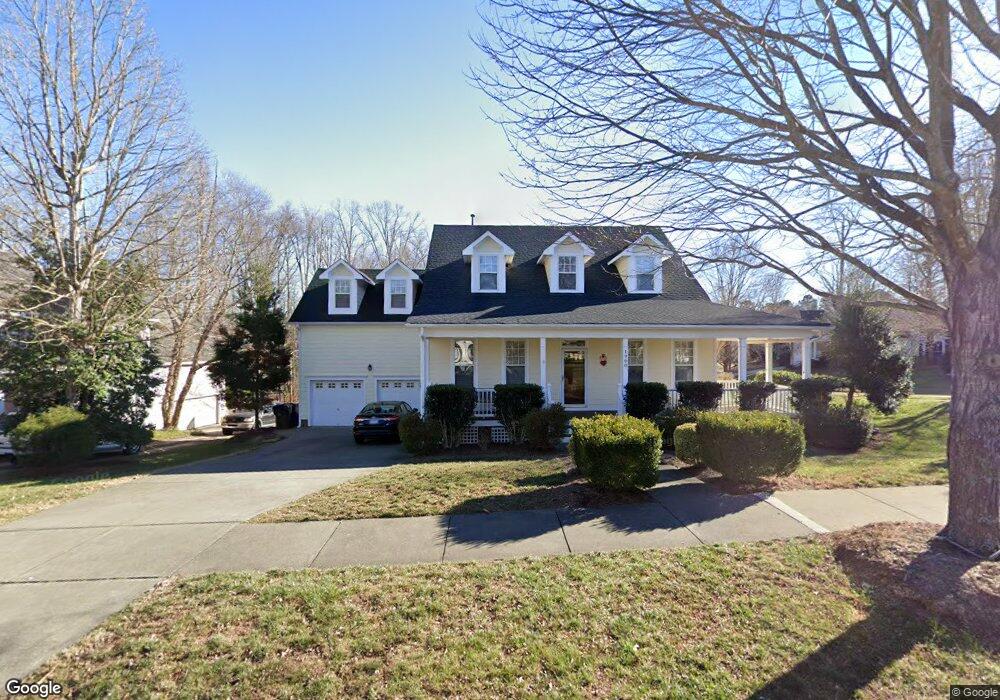
1900 Falls River Ave Raleigh, NC 27614
Falls River NeighborhoodEstimated Value: $617,000 - $643,000
3
Beds
3
Baths
2,496
Sq Ft
$252/Sq Ft
Est. Value
About This Home
This home is located at 1900 Falls River Ave, Raleigh, NC 27614 and is currently estimated at $628,846, approximately $251 per square foot. 1900 Falls River Ave is a home located in Wake County with nearby schools including Abbotts Creek Elementary School, East Millbrook Middle, and Millbrook High School.
Ownership History
Date
Name
Owned For
Owner Type
Purchase Details
Closed on
Sep 30, 2003
Sold by
Black David L and Black Sally
Bought by
Ewing David B and Ewing Kimberly A
Current Estimated Value
Home Financials for this Owner
Home Financials are based on the most recent Mortgage that was taken out on this home.
Original Mortgage
$204,000
Outstanding Balance
$83,921
Interest Rate
4.5%
Mortgage Type
Purchase Money Mortgage
Estimated Equity
$544,925
Purchase Details
Closed on
Aug 28, 2000
Sold by
C Richard Dobson Builders Inc
Bought by
Black David L and Black Sally
Home Financials for this Owner
Home Financials are based on the most recent Mortgage that was taken out on this home.
Original Mortgage
$185,400
Interest Rate
8.07%
Purchase Details
Closed on
Jun 10, 1999
Sold by
Crosspointe Inc
Bought by
Carey William C and Carey Kathy E
Home Financials for this Owner
Home Financials are based on the most recent Mortgage that was taken out on this home.
Original Mortgage
$199,100
Interest Rate
6.87%
Create a Home Valuation Report for This Property
The Home Valuation Report is an in-depth analysis detailing your home's value as well as a comparison with similar homes in the area
Home Values in the Area
Average Home Value in this Area
Purchase History
| Date | Buyer | Sale Price | Title Company |
|---|---|---|---|
| Ewing David B | $255,000 | -- | |
| Black David L | $206,000 | -- | |
| Carey William C | $210,000 | -- |
Source: Public Records
Mortgage History
| Date | Status | Borrower | Loan Amount |
|---|---|---|---|
| Open | Ewing David B | $204,000 | |
| Previous Owner | Black David L | $185,400 | |
| Previous Owner | Carey William C | $199,100 | |
| Closed | Ewing David B | $38,250 |
Source: Public Records
Tax History Compared to Growth
Tax History
| Year | Tax Paid | Tax Assessment Tax Assessment Total Assessment is a certain percentage of the fair market value that is determined by local assessors to be the total taxable value of land and additions on the property. | Land | Improvement |
|---|---|---|---|---|
| 2025 | $5,534 | $632,303 | $135,000 | $497,303 |
| 2024 | $5,512 | $632,303 | $135,000 | $497,303 |
| 2023 | $4,026 | $367,480 | $91,000 | $276,480 |
| 2022 | $3,741 | $367,480 | $91,000 | $276,480 |
| 2021 | $3,535 | $361,256 | $91,000 | $270,256 |
| 2020 | $3,471 | $361,256 | $91,000 | $270,256 |
| 2019 | $3,649 | $313,137 | $86,000 | $227,137 |
| 2018 | $3,441 | $313,137 | $86,000 | $227,137 |
| 2017 | $3,278 | $313,137 | $86,000 | $227,137 |
| 2016 | $3,210 | $313,137 | $86,000 | $227,137 |
| 2015 | $3,259 | $312,766 | $86,000 | $226,766 |
| 2014 | $3,091 | $312,766 | $86,000 | $226,766 |
Source: Public Records
Map
Nearby Homes
- 10415 Ashmead Ln
- 1741 Farmington Grove Dr
- 10205 Sorrills Creek Ln
- 1700 Southwell Ct
- 10209 River Bank Dr
- 2136 Dunn Rd
- 4615 All Points View Way
- 10907 Flower Bed Ct
- 10621 Catara Dr
- 1310 Durlain Dr Unit 103
- 2313 Filigree Ct
- 1301 Durlain Dr Unit 103
- 10904 Fitzwilliam St
- 4406 Crystal Breeze St
- 1804 Falls Landing Dr
- 1808 Falls Landing Dr
- 10821 Farmville Rd
- 2051 Dunn Rd
- 1911 Falls Landing Dr Unit 103
- 1911 Falls Landing Dr Unit 106
- 1920 Falls River Ave
- 1920 Farmington Grove Dr
- 1852 Falls River Ave
- 1828 Falls River Ave
- 1916 Farmington Grove Dr
- 1915 Farmington Grove Dr
- 2001 Farmington Grove Dr
- 1912 Farmington Grove Dr
- 1919 Oakboro Dr
- 1824 Falls River Ave
- 2001 Oakboro Dr
- 1915 Oakboro Dr
- 1909 Farmington Grove Dr
- 1908 Farmington Grove Dr
- 1826 Oakboro Dr
- 2005 Oakboro Dr
- 1825 Falls River Ave
- 1909 Oakboro Dr
- 1820 Falls River Ave
- 1901 Farmington Grove Dr