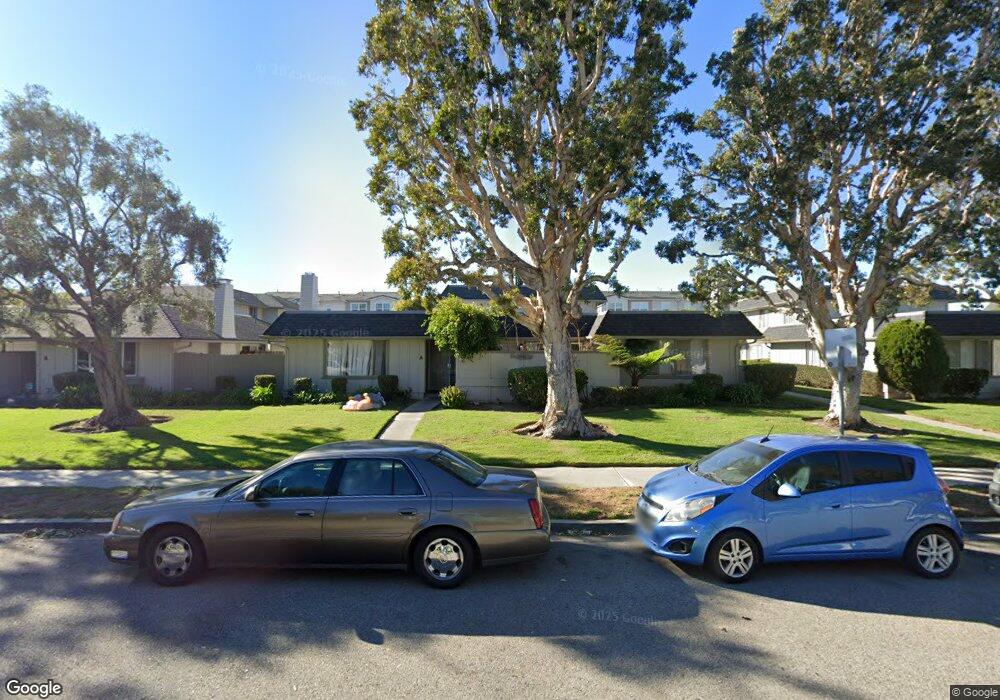
1901 Fisher Drive B Oxnard, CA 93035
Via Marina NeighborhoodEstimated Value: $510,000 - $568,876
3
Beds
2
Baths
1,124
Sq Ft
$482/Sq Ft
Est. Value
About This Home
This home is located at 1901 Fisher Drive B, Oxnard, CA 93035 and is currently estimated at $541,969, approximately $482 per square foot. 1901 Fisher Drive B is a home located in Ventura County with nearby schools including Christa Mcauliffe Elementary School and Oxnard High School.
Ownership History
Date
Name
Owned For
Owner Type
Purchase Details
Closed on
Aug 5, 2016
Sold by
Garibay Christopher Paul
Bought by
Moll Garibay Christine E
Current Estimated Value
Home Financials for this Owner
Home Financials are based on the most recent Mortgage that was taken out on this home.
Original Mortgage
$210,000
Outstanding Balance
$167,101
Interest Rate
3.48%
Mortgage Type
Commercial
Estimated Equity
$374,868
Purchase Details
Closed on
Jul 8, 2016
Sold by
Wilson Stephen and Wilson Kelley
Bought by
Moll Garibay Christine E
Home Financials for this Owner
Home Financials are based on the most recent Mortgage that was taken out on this home.
Original Mortgage
$210,000
Outstanding Balance
$167,101
Interest Rate
3.48%
Mortgage Type
Commercial
Estimated Equity
$374,868
Purchase Details
Closed on
Mar 24, 2006
Sold by
Wilson Stephen
Bought by
Wilson Stephen and Wilson Kelley
Home Financials for this Owner
Home Financials are based on the most recent Mortgage that was taken out on this home.
Original Mortgage
$180,000
Interest Rate
6.25%
Mortgage Type
New Conventional
Purchase Details
Closed on
Apr 6, 2004
Sold by
Fitzmorris Timothy and Fitzmorris Nancy B
Bought by
Wilson Stephen
Purchase Details
Closed on
Feb 25, 1994
Sold by
Owens Linda L
Bought by
Fitzmorris Timothy and Fitzmorris Nancy B
Home Financials for this Owner
Home Financials are based on the most recent Mortgage that was taken out on this home.
Original Mortgage
$89,600
Interest Rate
7%
Purchase Details
Closed on
Jan 15, 1994
Sold by
Kittredge Lloyd O
Bought by
Owens Linda L
Home Financials for this Owner
Home Financials are based on the most recent Mortgage that was taken out on this home.
Original Mortgage
$89,600
Interest Rate
7%
Create a Home Valuation Report for This Property
The Home Valuation Report is an in-depth analysis detailing your home's value as well as a comparison with similar homes in the area
Home Values in the Area
Average Home Value in this Area
Purchase History
| Date | Buyer | Sale Price | Title Company |
|---|---|---|---|
| Moll Garibay Christine E | -- | Chicago Title Company | |
| Moll Garibay Christine E | $300,000 | Chicago Title Company | |
| Wilson Stephen | -- | Alliance Title Company | |
| Wilson Stephen | -- | First American Title Co | |
| Fitzmorris Timothy | $112,000 | United Title Company | |
| Owens Linda L | -- | United Title Company |
Source: Public Records
Mortgage History
| Date | Status | Borrower | Loan Amount |
|---|---|---|---|
| Open | Moll Garibay Christine E | $210,000 | |
| Previous Owner | Wilson Stephen | $180,000 | |
| Previous Owner | Fitzmorris Timothy | $89,600 | |
| Closed | Fitzmorris Timothy | $11,200 |
Source: Public Records
Tax History
| Year | Tax Paid | Tax Assessment Tax Assessment Total Assessment is a certain percentage of the fair market value that is determined by local assessors to be the total taxable value of land and additions on the property. | Land | Improvement |
|---|---|---|---|---|
| 2025 | $4,237 | $348,170 | $226,313 | $121,857 |
| 2024 | $4,237 | $341,344 | $221,876 | $119,468 |
| 2023 | $4,083 | $334,651 | $217,525 | $117,126 |
| 2022 | $3,960 | $328,090 | $213,260 | $114,830 |
| 2021 | $3,929 | $321,657 | $209,078 | $112,579 |
| 2020 | $4,001 | $318,361 | $206,935 | $111,426 |
| 2019 | $3,889 | $312,120 | $202,878 | $109,242 |
| 2018 | $3,835 | $306,000 | $198,900 | $107,100 |
| 2017 | $3,640 | $300,000 | $195,000 | $105,000 |
| 2016 | $1,879 | $155,730 | $62,290 | $93,440 |
| 2015 | $1,899 | $153,393 | $61,355 | $92,038 |
| 2014 | $1,878 | $150,390 | $60,154 | $90,236 |
Source: Public Records
Map
Nearby Homes
- 3644 Islander Walk
- 734 W Hemlock St
- 732 W Hemlock St
- 729 Halyard St
- 3729 Islander Walk
- 2643 Anchor Ave
- 2615 Yardarm Ave
- 2646 Victoria Ave
- 1901 Victoria Ave Unit 204
- 2620 Tiller Ave
- 2612 Tiller Ave
- 2610 Tiller Ave
- 2582 Spinnaker Ave
- 2563 Spinnaker Ave
- 2585 Anchor Ave
- 1901 S Victoria Ave Unit 116
- 1901 S Victoria Ave Unit 115
- 2554 Spinnaker Ave
- 2014 Napoli Dr
- 2606 Rudder Ave
- 1901 Fisher Drive B Unit A
- 1901 Fisher Dr
- 1901 Fisher Dr Unit C
- 1901 Fisher Dr Unit A
- 1901 Fisher Dr Unit B
- 1901 Fisher Dr Unit D
- 1901 Fisher Dr
- 1901 Fisher Dr Unit 15
- 1901 Fisher Dr Unit 14
- 1901 Fisher Dr Unit 16
- 1901 Fisher Dr Unit 13
- 1911 Fisher Dr Unit B
- 1911 Fisher Dr Unit D
- 1911 Fisher Dr Unit C
- 1911 Fisher Dr Unit 11C
- 1911 Fisher Dr Unit 10
- 1911 Fisher Dr Unit 12
- 1911 Fisher Dr Unit 9A
- 1851 Fisher Dr Unit B
- 1851 Fisher Dr Unit C
Your Personal Tour Guide
Ask me questions while you tour the home.