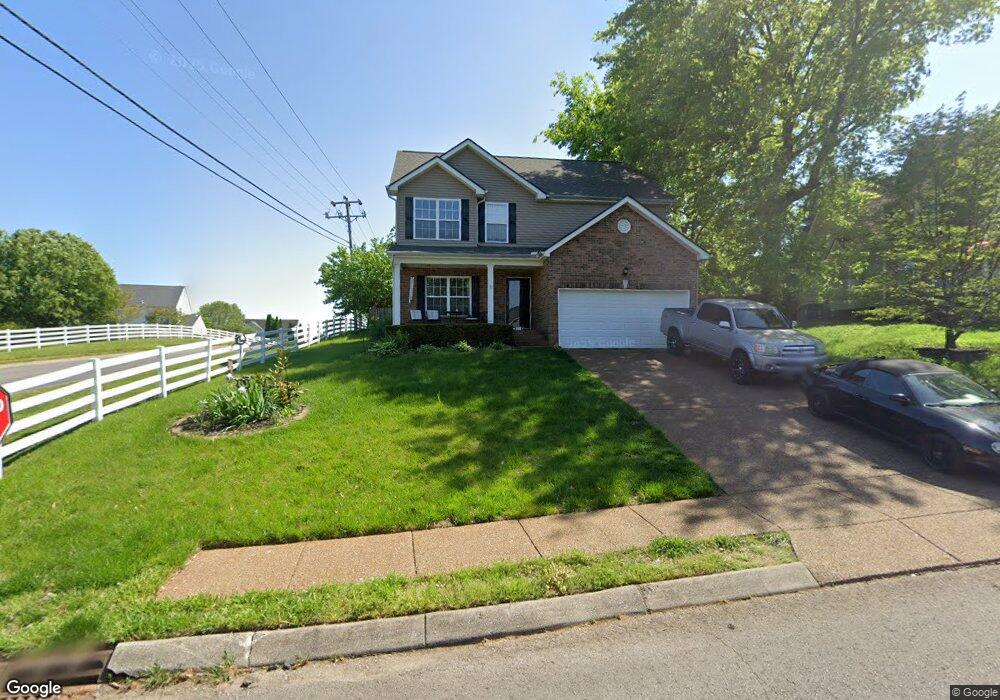
1901 Hamelton Cir Spring Hill, TN 37174
Estimated Value: $456,851 - $554,000
--
Bed
4
Baths
2,134
Sq Ft
$235/Sq Ft
Est. Value
About This Home
This home is located at 1901 Hamelton Cir, Spring Hill, TN 37174 and is currently estimated at $501,963, approximately $235 per square foot. 1901 Hamelton Cir is a home located in Williamson County with nearby schools including Allendale Elementary School, Summit High School, and Primrose School of Spring Hill.
Ownership History
Date
Name
Owned For
Owner Type
Purchase Details
Closed on
Jun 19, 2015
Sold by
Turner James and Turner Deena M
Bought by
Cope Christopher H
Current Estimated Value
Home Financials for this Owner
Home Financials are based on the most recent Mortgage that was taken out on this home.
Original Mortgage
$212,385
Outstanding Balance
$165,490
Interest Rate
3.92%
Mortgage Type
Purchase Money Mortgage
Estimated Equity
$336,473
Purchase Details
Closed on
Oct 12, 2006
Sold by
Turner Deena M
Bought by
Turner James
Purchase Details
Closed on
May 19, 2006
Sold by
Ecotech Llc
Bought by
Turner James and Turner Deena M
Home Financials for this Owner
Home Financials are based on the most recent Mortgage that was taken out on this home.
Original Mortgage
$209,709
Interest Rate
6.39%
Mortgage Type
FHA
Create a Home Valuation Report for This Property
The Home Valuation Report is an in-depth analysis detailing your home's value as well as a comparison with similar homes in the area
Home Values in the Area
Average Home Value in this Area
Purchase History
| Date | Buyer | Sale Price | Title Company |
|---|---|---|---|
| Cope Christopher H | $210,000 | Mid State Title & Escrow Inc | |
| Turner James | -- | Realty Title & Escrow Co Inc | |
| Turner James | $213,000 | Jack Case Wilson Title Assoc |
Source: Public Records
Mortgage History
| Date | Status | Borrower | Loan Amount |
|---|---|---|---|
| Open | Cope Christopher H | $212,385 | |
| Previous Owner | Turner James | $209,709 |
Source: Public Records
Tax History Compared to Growth
Tax History
| Year | Tax Paid | Tax Assessment Tax Assessment Total Assessment is a certain percentage of the fair market value that is determined by local assessors to be the total taxable value of land and additions on the property. | Land | Improvement |
|---|---|---|---|---|
| 2024 | $600 | $81,250 | $17,500 | $63,750 |
| 2023 | $600 | $81,250 | $17,500 | $63,750 |
| 2022 | $1,487 | $81,250 | $17,500 | $63,750 |
| 2021 | $1,487 | $81,250 | $17,500 | $63,750 |
| 2020 | $1,288 | $59,650 | $11,250 | $48,400 |
| 2019 | $1,288 | $59,650 | $11,250 | $48,400 |
| 2018 | $1,247 | $59,650 | $11,250 | $48,400 |
| 2017 | $1,235 | $59,650 | $11,250 | $48,400 |
| 2016 | $1,217 | $59,650 | $11,250 | $48,400 |
| 2015 | -- | $49,500 | $10,000 | $39,500 |
| 2014 | -- | $49,500 | $10,000 | $39,500 |
Source: Public Records
Map
Nearby Homes
- 1826 Nantes Ct
- 2606 Danbury Cir
- 2018 Trenton Dr
- 2639 Danbury Cir
- 1863 Devon Dr
- 1443 Bern Dr
- 1602 Zurich Dr
- 2105 Burgess Ln
- 1882 Portway Rd
- 417 Alcott Way
- 2011 Spring Meadow Cir
- 3008 Romain Trail
- 4002 Pennick Ct
- 6001 Romain Ct
- 2255 Dewey Dr
- 2108 Somersby Trail
- 147 Millbrook Dr
- 613 Conifer Dr
- 2271 Dewey Dr Unit J2
- 2271 Dewey Dr Unit B1
- 1903 Hamelton Cir
- 1738 Dryden Dr
- 2601 Danbury Cir
- 1734 Dryden Dr
- 2002 Trenton Dr
- 1905 Hamelton Cir
- 2300 Leighton Way
- 1821 Nantes Ct
- 2306 Leighton Way
- 2004 Trenton Dr
- 2603 Danbury Cir
- 2659 Danbury Cir
- 1825 Nantes Ct
- 1907 Hamelton Cir
- 1730 Dryden Dr
- 1817 Nantes Ct
- 2310 Leighton Way
- 1735 Dryden Dr
- 2003 Trenton Dr
- 2301 Leighton Way