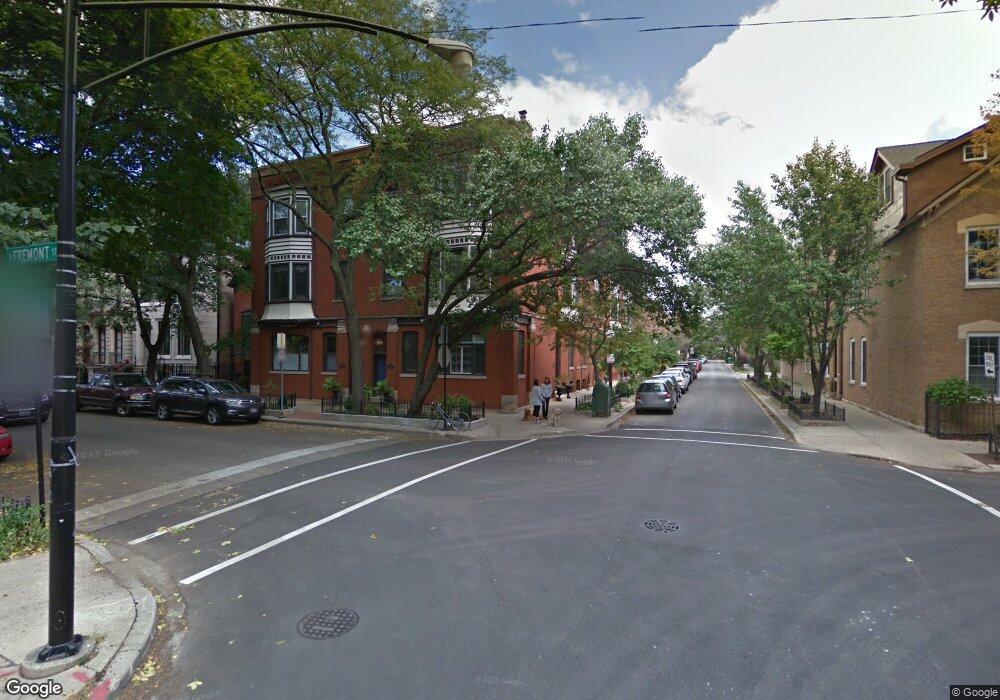
1901 N Fremont St Unit 850C Chicago, IL 60614
Old Town NeighborhoodEstimated Value: $448,710 - $606,000
1
Bed
1
Bath
19,000
Sq Ft
$28/Sq Ft
Est. Value
About This Home
This home is located at 1901 N Fremont St Unit 850C, Chicago, IL 60614 and is currently estimated at $532,678, approximately $28 per square foot. 1901 N Fremont St Unit 850C is a home located in Cook County with nearby schools including Mayer Elementary School, Lincoln Park High School, and St. James Lutheran School.
Ownership History
Date
Name
Owned For
Owner Type
Purchase Details
Closed on
Aug 14, 2020
Sold by
Knierim Anthony and Kreighbaum Maria
Bought by
Watson John and Watson William
Current Estimated Value
Home Financials for this Owner
Home Financials are based on the most recent Mortgage that was taken out on this home.
Original Mortgage
$303,750
Outstanding Balance
$268,945
Interest Rate
2.9%
Mortgage Type
New Conventional
Estimated Equity
$263,733
Purchase Details
Closed on
Oct 31, 2016
Sold by
Delaney Mark and Delaney Heather
Bought by
Knierim Anthony
Home Financials for this Owner
Home Financials are based on the most recent Mortgage that was taken out on this home.
Original Mortgage
$351,500
Interest Rate
3.5%
Mortgage Type
New Conventional
Purchase Details
Closed on
Jul 7, 2009
Sold by
Fox Louise H
Bought by
Delaney Mark
Home Financials for this Owner
Home Financials are based on the most recent Mortgage that was taken out on this home.
Original Mortgage
$298,493
Interest Rate
5.43%
Mortgage Type
FHA
Purchase Details
Closed on
Jan 13, 1998
Sold by
Fox Louise H and Diba Louise H
Bought by
Fox Louise H and Louise H Fox Living Trust
Create a Home Valuation Report for This Property
The Home Valuation Report is an in-depth analysis detailing your home's value as well as a comparison with similar homes in the area
Home Values in the Area
Average Home Value in this Area
Purchase History
| Date | Buyer | Sale Price | Title Company |
|---|---|---|---|
| Watson John | $405,000 | Chicago Title | |
| Knierim Anthony | $371,500 | Proper Title Llc | |
| Delaney Mark | $304,000 | Ticor Title | |
| Fox Louise H | -- | -- |
Source: Public Records
Mortgage History
| Date | Status | Borrower | Loan Amount |
|---|---|---|---|
| Open | Watson John | $303,750 | |
| Previous Owner | Knierim Anthony | $351,500 | |
| Previous Owner | Delaney Mark | $298,493 |
Source: Public Records
Tax History Compared to Growth
Tax History
| Year | Tax Paid | Tax Assessment Tax Assessment Total Assessment is a certain percentage of the fair market value that is determined by local assessors to be the total taxable value of land and additions on the property. | Land | Improvement |
|---|---|---|---|---|
| 2024 | $6,896 | $36,707 | $5,352 | $31,355 |
| 2023 | $6,701 | $36,000 | $4,316 | $31,684 |
| 2022 | $6,701 | $36,000 | $4,316 | $31,684 |
| 2021 | $6,569 | $35,999 | $4,316 | $31,683 |
| 2020 | $7,423 | $33,322 | $3,798 | $29,524 |
| 2019 | $7,271 | $36,191 | $3,798 | $32,393 |
| 2018 | $7,149 | $36,191 | $3,798 | $32,393 |
| 2017 | $5,858 | $27,212 | $3,107 | $24,105 |
| 2016 | $4,950 | $27,212 | $3,107 | $24,105 |
| 2015 | $4,506 | $27,212 | $3,107 | $24,105 |
| 2014 | $4,068 | $24,492 | $2,330 | $22,162 |
| 2013 | $3,976 | $24,492 | $2,330 | $22,162 |
Source: Public Records
Map
Nearby Homes
- 1837 N Fremont St
- 1836 N Dayton St Unit 1836
- 1921 N Dayton St
- 1927 N Dayton St
- 1862 N Halsted St Unit 3N
- 1822 N Fremont St
- 1823 N Bissell St
- 1928 N Bissell St
- 1851 N Halsted St Unit 2
- 1926 N Halsted St
- 1834 N Halsted St Unit A
- 1808 N Bissell St Unit 3A
- 1963 N Dayton St
- 1852 N Sheffield Ave
- 1725 N Fremont St
- 1962 N Bissell St
- 1914 N Sheffield Ave Unit 1
- 1955 N Halsted St Unit 1
- 1719 N Fremont St
- 1865 N Burling St
- 1901 N Fremont St Unit 3
- 1901 N Fremont St Unit 1901C
- 1901 N Fremont St Unit 854
- 1901 N Fremont St Unit 1903B
- 1901 N Fremont St Unit 1901B
- 1901 N Fremont St
- 850 W Wisconsin St Unit 850A
- 850 W Wisconsin St Unit 850B
- 850 W Wisconsin St Unit C
- 850 W Wisconsin St Unit 2B
- 1903 N Fremont St Unit 1903A
- 1903 N Fremont St Unit 1903C
- 1903 N Fremont St Unit B
- 1903 N Fremont St Unit 1
- 1903 N Fremont St Unit 2
- 1907 N Fremont St
- 848 W Wisconsin St
- 1875 N Fremont St
- 1875 N Fremont St
- 854 W Wisconsin St Unit A