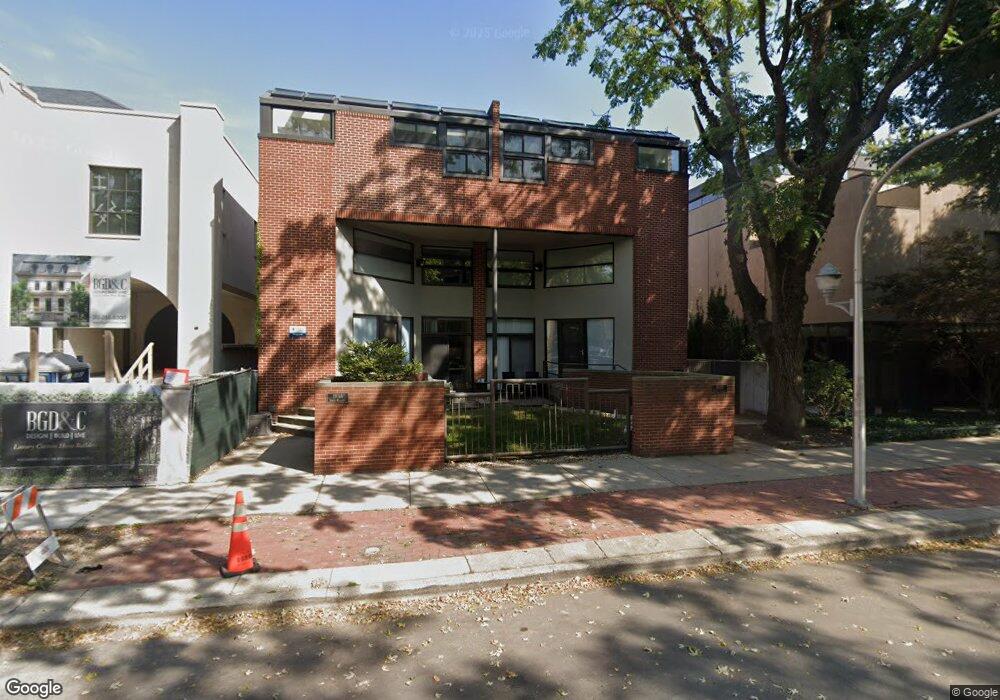
1901 N Orchard St Unit A Chicago, IL 60614
Old Town NeighborhoodEstimated Value: $642,000 - $956,282
--
Bed
--
Bath
8,530
Sq Ft
$90/Sq Ft
Est. Value
About This Home
This home is located at 1901 N Orchard St Unit A, Chicago, IL 60614 and is currently estimated at $768,821, approximately $90 per square foot. 1901 N Orchard St Unit A is a home located in Cook County with nearby schools including Abraham Lincoln Elementary School, Lincoln Park High School, and The Noble Academy.
Ownership History
Date
Name
Owned For
Owner Type
Purchase Details
Closed on
Feb 7, 2007
Sold by
Robinson Stacey L
Bought by
1901 Orchard Property Llc
Current Estimated Value
Purchase Details
Closed on
Feb 10, 2000
Sold by
Soderlund Karl A
Bought by
Robinson Stacey
Home Financials for this Owner
Home Financials are based on the most recent Mortgage that was taken out on this home.
Original Mortgage
$278,400
Interest Rate
7.87%
Purchase Details
Closed on
Jul 18, 1997
Sold by
Laarman James H and Laarman Jill Clark
Bought by
Soderlund Karl A
Home Financials for this Owner
Home Financials are based on the most recent Mortgage that was taken out on this home.
Original Mortgage
$211,650
Interest Rate
7.5%
Create a Home Valuation Report for This Property
The Home Valuation Report is an in-depth analysis detailing your home's value as well as a comparison with similar homes in the area
Home Values in the Area
Average Home Value in this Area
Purchase History
| Date | Buyer | Sale Price | Title Company |
|---|---|---|---|
| 1901 Orchard Property Llc | $555,000 | None Available | |
| Robinson Stacey | $348,000 | -- | |
| Soderlund Karl A | $249,000 | -- |
Source: Public Records
Mortgage History
| Date | Status | Borrower | Loan Amount |
|---|---|---|---|
| Previous Owner | Robinson Stacey | $278,400 | |
| Previous Owner | Soderlund Karl A | $211,650 |
Source: Public Records
Tax History Compared to Growth
Tax History
| Year | Tax Paid | Tax Assessment Tax Assessment Total Assessment is a certain percentage of the fair market value that is determined by local assessors to be the total taxable value of land and additions on the property. | Land | Improvement |
|---|---|---|---|---|
| 2024 | $11,888 | $53,251 | $19,552 | $33,699 |
| 2023 | $11,589 | $56,347 | $15,767 | $40,580 |
| 2022 | $11,589 | $56,347 | $15,767 | $40,580 |
| 2021 | $10,066 | $50,055 | $15,767 | $34,288 |
| 2020 | $11,248 | $50,490 | $13,875 | $36,615 |
| 2019 | $11,017 | $54,836 | $13,875 | $40,961 |
| 2018 | $10,832 | $54,836 | $13,875 | $40,961 |
| 2017 | $9,558 | $44,400 | $11,352 | $33,048 |
| 2016 | $8,893 | $44,400 | $11,352 | $33,048 |
| 2015 | $8,136 | $44,400 | $11,352 | $33,048 |
| 2014 | $4,919 | $26,513 | $8,514 | $17,999 |
| 2013 | $4,822 | $26,513 | $8,514 | $17,999 |
Source: Public Records
Map
Nearby Homes
- 1878 N Orchard St
- 1865 N Burling St
- 1853 N Burling St
- 1913 N Halsted St Unit 1
- 1851 N Halsted St Unit 2
- 1862 N Halsted St Unit 3N
- 1926 N Halsted St
- 1964 N Burling St
- 1921 N Dayton St
- 1848 N Dayton St
- 1836 N Dayton St Unit 1836
- 1812 N Dayton St Unit 1812
- 1849 N Mohawk St Unit 2
- 1837 N Fremont St
- 1724 N Mohawk St Unit 2
- 1646 N Orchard St Unit PHS
- 1646 N Orchard St Unit 2
- 1720 N Mohawk St
- 1733 N Mohawk St Unit 3N
- 505 W Menomonee St
- 1901 N Orchard St Unit E
- 1901 N Orchard St Unit B
- 1901 N Orchard St Unit D
- 1901 N Orchard St
- 1901 N Orchard St Unit C
- 1901 N Orchard St Unit DAR
- 1903 N Orchard St
- 1903 N Orchard St
- 1907 N Orchard St
- 1907 N Orchard St
- 1909 N Orchard St Unit K
- 1909 N Orchard St Unit E
- 1909 N Orchard St Unit I
- 1909 N Orchard St Unit B
- 1909 N Orchard St Unit G
- 1909 N Orchard St Unit C
- 1909 N Orchard St Unit F
- 1909 N Orchard St Unit H
- 1909 N Orchard St Unit A
- 1909 N Orchard St Unit J