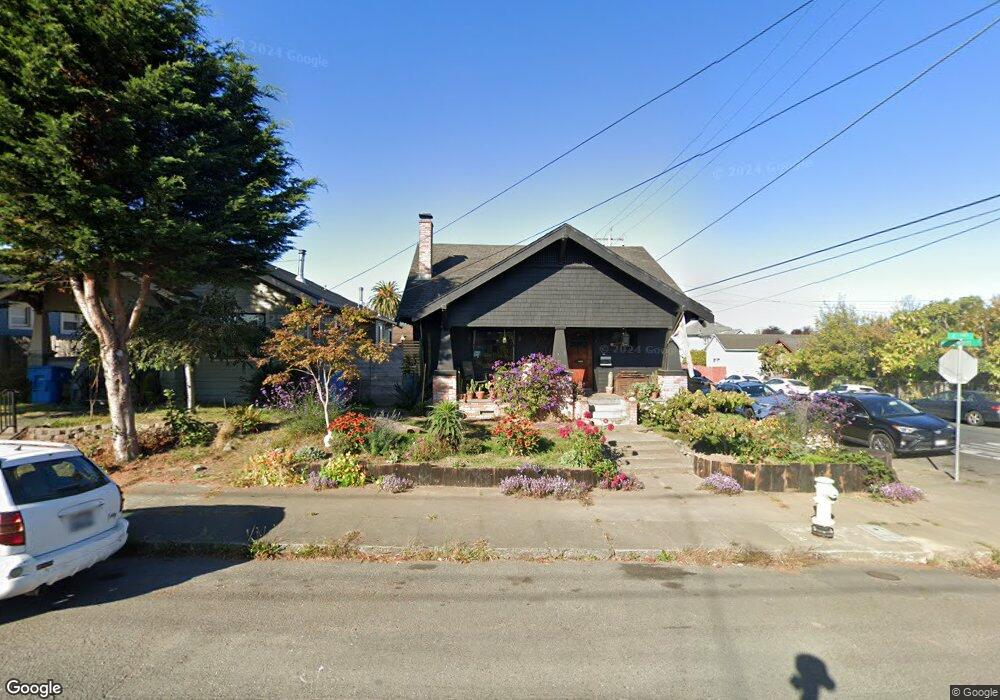
1902 A St Eureka, CA 95501
Fairfield NeighborhoodEstimated Value: $329,000 - $420,000
4
Beds
1
Bath
2,400
Sq Ft
$156/Sq Ft
Est. Value
About This Home
This home is located at 1902 A St, Eureka, CA 95501 and is currently estimated at $375,311, approximately $156 per square foot. 1902 A St is a home located in Humboldt County with nearby schools including Grant Elementary School, Winship Middle School, and Eureka Senior High School.
Ownership History
Date
Name
Owned For
Owner Type
Purchase Details
Closed on
Jun 14, 2022
Sold by
Patricia Frances Young Revocable Trust
Bought by
Young Edwin Brian and Young Carra Anne
Current Estimated Value
Purchase Details
Closed on
Feb 24, 2021
Sold by
Young Patricia F
Bought by
Young Patricia F and Young Patricia Frances
Purchase Details
Closed on
Sep 26, 2003
Sold by
Martinek David E and Martinek Christina Ann
Bought by
Young Eddie B and Young Patricia F
Home Financials for this Owner
Home Financials are based on the most recent Mortgage that was taken out on this home.
Original Mortgage
$175,750
Interest Rate
6%
Mortgage Type
Purchase Money Mortgage
Create a Home Valuation Report for This Property
The Home Valuation Report is an in-depth analysis detailing your home's value as well as a comparison with similar homes in the area
Home Values in the Area
Average Home Value in this Area
Purchase History
| Date | Buyer | Sale Price | Title Company |
|---|---|---|---|
| Young Edwin Brian | -- | Gaudy Law Inc | |
| Young Patricia F | -- | None Available | |
| Young Eddie B | $185,000 | Humboldt Land Title Company |
Source: Public Records
Mortgage History
| Date | Status | Borrower | Loan Amount |
|---|---|---|---|
| Previous Owner | Young Eddie B | $175,750 |
Source: Public Records
Tax History
| Year | Tax Paid | Tax Assessment Tax Assessment Total Assessment is a certain percentage of the fair market value that is determined by local assessors to be the total taxable value of land and additions on the property. | Land | Improvement |
|---|---|---|---|---|
| 2025 | $2,882 | $263,011 | $71,078 | $191,933 |
| 2024 | $2,882 | $257,855 | $69,685 | $188,170 |
| 2023 | $2,667 | $252,800 | $68,319 | $184,481 |
| 2022 | $2,768 | $247,844 | $66,980 | $180,864 |
| 2021 | $2,027 | $190,000 | $60,047 | $129,953 |
| 2020 | $2,033 | $190,000 | $60,047 | $129,953 |
| 2019 | $2,031 | $190,000 | $60,047 | $129,953 |
| 2018 | $2,041 | $190,000 | $60,047 | $129,953 |
| 2017 | $2,071 | $190,000 | $60,047 | $129,953 |
| 2016 | $1,957 | $176,000 | $57,988 | $118,012 |
| 2015 | $1,969 | $176,000 | $57,988 | $118,012 |
| 2014 | $1,878 | $214,562 | $57,988 | $156,574 |
Source: Public Records
Map
Nearby Homes
Your Personal Tour Guide
Ask me questions while you tour the home.