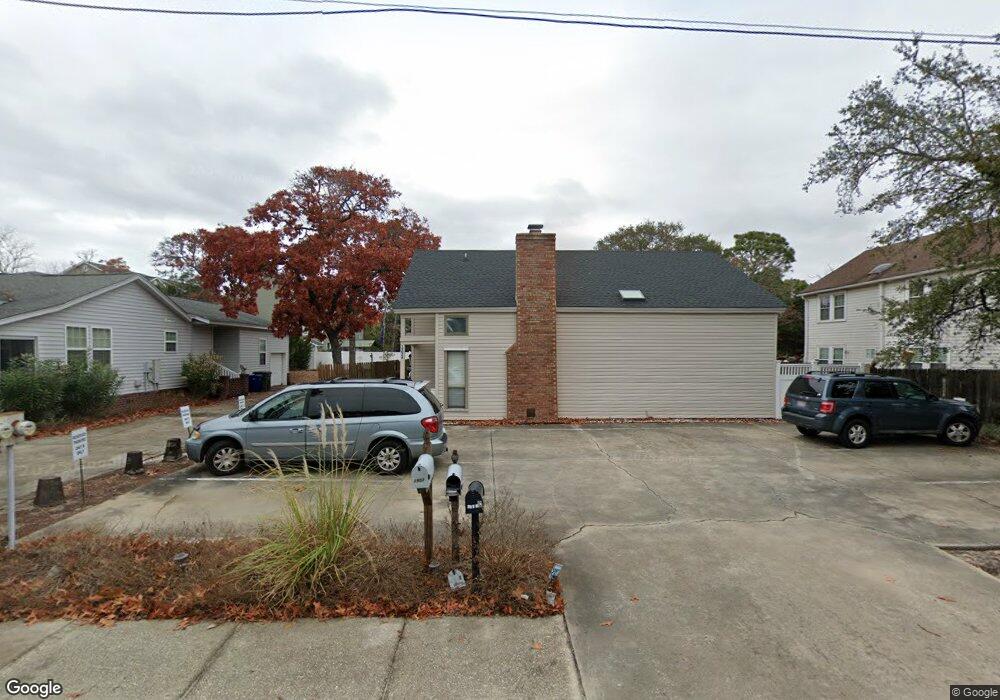
1902 Hillside Dr S Unit A North Myrtle Beach, SC 29582
Crescent Beach NeighborhoodEstimated Value: $402,000 - $424,000
3
Beds
2
Baths
1,587
Sq Ft
$259/Sq Ft
Est. Value
About This Home
This home is located at 1902 Hillside Dr S Unit A, North Myrtle Beach, SC 29582 and is currently estimated at $411,785, approximately $259 per square foot. 1902 Hillside Dr S Unit A is a home located in Horry County with nearby schools including Ocean Drive Elementary School, North Myrtle Beach Middle School, and North Myrtle Beach High School.
Ownership History
Date
Name
Owned For
Owner Type
Purchase Details
Closed on
Jan 28, 2021
Sold by
Mcginnis Michael D
Bought by
Walsh Ryan D and Walsh Kristine M
Current Estimated Value
Home Financials for this Owner
Home Financials are based on the most recent Mortgage that was taken out on this home.
Original Mortgage
$192,000
Outstanding Balance
$171,425
Interest Rate
2.6%
Mortgage Type
New Conventional
Estimated Equity
$240,360
Purchase Details
Closed on
Dec 2, 2015
Sold by
Collier Neil A
Bought by
Mcginnis Michael D
Purchase Details
Closed on
May 10, 2013
Sold by
Cpsrmof Ii 2012A Trust
Bought by
Collier Neil A
Purchase Details
Closed on
Dec 3, 2012
Sold by
Master In Equity Horry County
Bought by
Flagstar Bank
Purchase Details
Closed on
Feb 9, 2006
Sold by
Hensley Davis I
Bought by
Hensley Davis I and Hensley Monique
Purchase Details
Closed on
Dec 10, 2002
Sold by
Robinson Ronny D and Robinson Ronny Douglas
Bought by
Hensley Davis I
Home Financials for this Owner
Home Financials are based on the most recent Mortgage that was taken out on this home.
Original Mortgage
$85,000
Interest Rate
5.92%
Mortgage Type
Purchase Money Mortgage
Create a Home Valuation Report for This Property
The Home Valuation Report is an in-depth analysis detailing your home's value as well as a comparison with similar homes in the area
Home Values in the Area
Average Home Value in this Area
Purchase History
| Date | Buyer | Sale Price | Title Company |
|---|---|---|---|
| Walsh Ryan D | $240,000 | -- | |
| Mcginnis Michael D | $192,500 | -- | |
| Collier Neil A | $139,900 | -- | |
| Cpsrmof Ii 2012A Trust | -- | -- | |
| Flagstar Bank | $100,000 | -- | |
| Hensley Davis I | -- | None Available | |
| Hensley Davis I | $39,000 | -- |
Source: Public Records
Mortgage History
| Date | Status | Borrower | Loan Amount |
|---|---|---|---|
| Open | Walsh Ryan D | $192,000 | |
| Previous Owner | Hensley Davis I | $85,000 |
Source: Public Records
Tax History Compared to Growth
Tax History
| Year | Tax Paid | Tax Assessment Tax Assessment Total Assessment is a certain percentage of the fair market value that is determined by local assessors to be the total taxable value of land and additions on the property. | Land | Improvement |
|---|---|---|---|---|
| 2024 | $4,266 | $25,859 | $15,000 | $10,859 |
| 2023 | $4,266 | $12,577 | $5,252 | $7,325 |
| 2021 | $3,883 | $13,453 | $6,127 | $7,326 |
| 2020 | $2,815 | $13,453 | $6,127 | $7,326 |
| 2019 | $2,716 | $13,453 | $6,127 | $7,326 |
| 2018 | $0 | $10,936 | $1,714 | $9,222 |
| 2017 | $2,481 | $10,936 | $1,714 | $9,222 |
| 2016 | -- | $10,936 | $1,714 | $9,222 |
| 2015 | $2,064 | $9,177 | $1,491 | $7,686 |
| 2014 | $1,995 | $9,177 | $1,491 | $7,686 |
Source: Public Records
Map
Nearby Homes
- 607 18th Ave S
- 1807 Hillside Dr S
- 505 19th Ave S
- 1911 Madison Dr
- 1901 Highway 17 S
- 1909 Hwy 17 S
- TBD Highway 17 S Unit .24 acres
- TBD Highway 17 S Unit next to Dick's Pawn
- 806 20th Ave S
- 2010 Hillside Dr S
- 1710 Holly Dr
- 2602 Holly Dr
- 1621 Edge Dr Unit U14
- 1706 Holly Dr
- 1718 Perrin Dr
- 2005 Havens Dr
- 401 17th Ave S
- 1706 Perrin Dr Unit 401
- 1906 S Ocean Blvd
- 1612 Edge Dr
- 1902 Hillside Dr S Unit 1902
- 1902 Hillside Dr S Unit C
- 1902 Hillside Dr S Unit B
- 1902 Hillside Dr S Unit A
- 1904 Hillside Dr S
- 1900 Hillside Dr S
- 1901 Hillside Dr S
- 1901 Hillside Dr S Unit 1901
- 507 19th Ave S
- 605 19th Ave S Unit 605 19th Av So
- 605 19th Ave S
- 1812 Hillside Dr S
- 1905 Hillside Dr S Unit 1905
- 1905 Hillside Dr S
- 1906 Hillside Dr S
- 1907 Hillside Dr S
- 607 19th Ave S
- 1811 Hillside Dr S
- 1810A Hillside Dr S
- 1909 Hillside Dr S