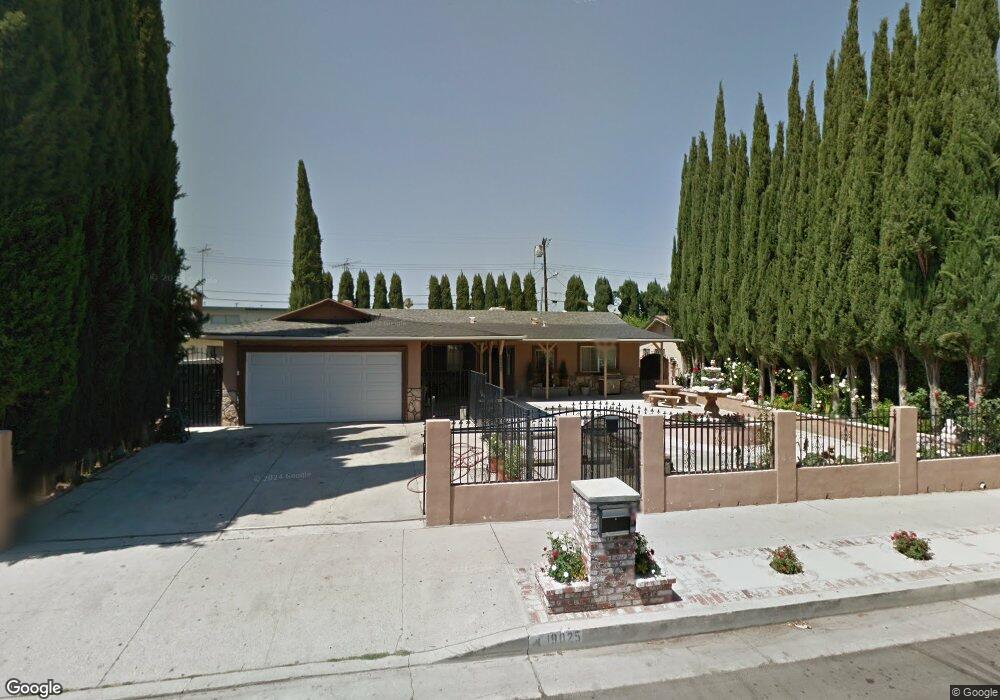
19025 Napa St Northridge, CA 91324
Estimated Value: $786,947 - $895,000
3
Beds
2
Baths
1,288
Sq Ft
$641/Sq Ft
Est. Value
About This Home
This home is located at 19025 Napa St, Northridge, CA 91324 and is currently estimated at $825,737, approximately $641 per square foot. 19025 Napa St is a home located in Los Angeles County with nearby schools including Napa Street Elementary School, Northridge Middle School, and Northridge Academy High.
Ownership History
Date
Name
Owned For
Owner Type
Purchase Details
Closed on
Dec 29, 2004
Sold by
Deloera Pablo and Deloera Maria
Bought by
Deloera Pablo
Current Estimated Value
Home Financials for this Owner
Home Financials are based on the most recent Mortgage that was taken out on this home.
Original Mortgage
$386,750
Interest Rate
6.75%
Mortgage Type
New Conventional
Purchase Details
Closed on
Nov 21, 2003
Sold by
Deloera Pablo and Deloera Maria
Bought by
Deloera Pablo
Purchase Details
Closed on
Sep 18, 2001
Sold by
Deloera Pablo and Deloera Dolores
Bought by
Deloera Pablo
Purchase Details
Closed on
Jul 23, 1996
Sold by
Deloera Jose Jaime
Bought by
Moreno Pablo Deloera and Deloera Maria Dolores
Home Financials for this Owner
Home Financials are based on the most recent Mortgage that was taken out on this home.
Original Mortgage
$122,250
Interest Rate
8.32%
Create a Home Valuation Report for This Property
The Home Valuation Report is an in-depth analysis detailing your home's value as well as a comparison with similar homes in the area
Home Values in the Area
Average Home Value in this Area
Purchase History
| Date | Buyer | Sale Price | Title Company |
|---|---|---|---|
| Deloera Pablo | -- | Ticor Title Company Of Ca | |
| Deloera Pablo | -- | Ticor Title Company | |
| Deloera Pablo | -- | First Southwestern Title | |
| Moreno Pablo Deloera | -- | American Title Ins Co |
Source: Public Records
Mortgage History
| Date | Status | Borrower | Loan Amount |
|---|---|---|---|
| Closed | Deloera Pablo | $386,750 | |
| Closed | Moreno Pablo Deloera | $122,250 | |
| Closed | Deloera Pablo | $0 |
Source: Public Records
Tax History
| Year | Tax Paid | Tax Assessment Tax Assessment Total Assessment is a certain percentage of the fair market value that is determined by local assessors to be the total taxable value of land and additions on the property. | Land | Improvement |
|---|---|---|---|---|
| 2025 | $3,369 | $251,423 | $176,945 | $74,478 |
| 2024 | $3,369 | $246,494 | $173,476 | $73,018 |
| 2023 | $3,311 | $241,662 | $170,075 | $71,587 |
| 2022 | $3,168 | $236,925 | $166,741 | $70,184 |
| 2021 | $3,127 | $232,280 | $163,472 | $68,808 |
| 2020 | $3,153 | $229,899 | $161,796 | $68,103 |
| 2019 | $3,041 | $225,392 | $158,624 | $66,768 |
| 2018 | $2,883 | $220,973 | $155,514 | $65,459 |
| 2016 | $2,748 | $212,394 | $149,476 | $62,918 |
| 2015 | $2,711 | $209,204 | $147,231 | $61,973 |
| 2014 | $2,729 | $205,107 | $144,347 | $60,760 |
Source: Public Records
Map
Nearby Homes
- 19006 Eccles St
- 8356 Vanalden Ave
- 19016 Schoenborn St
- 19046 Schoenborn St
- 18720 Chase St
- 27 Essex Dr
- 18649 Chase St
- 18725 Schoenborn St
- 4 Oxford Way
- 11 Oxford Way
- 19106 Cantara St
- 9000 Vanalden Ave Unit 108
- 9000 Vanalden Ave Unit 175
- 18557 Napa St
- 18535 Bryant St
- 19029 Nordhoff St Unit 205
- 8119 Geyser Ave
- 19545 Bryant St
- 9101 Geyser Ave
- 8450 Melvin Ave
- 19019 Napa St
- 19031 Napa St
- 19013 Napa St
- 19037 Napa St
- 8603 Wystone Ave
- 19045 Napa St
- 19036 Napa St
- 19051 Napa St
- 18959 Napa St
- 8606 Vanalden Ave
- 8556 Vanalden Ave
- 8612 Wystone Ave Unit 3
- 8612 Wystone Ave Unit 2 & 3
- 8612 Wystone Ave
- 8546 Vanalden Ave
- 8536 Vanalden Ave
- 18951 Napa St
- 8532 Vanalden Ave
- 8605 Vanalden Ave
- 8528 Vanalden Ave
Your Personal Tour Guide
Ask me questions while you tour the home.