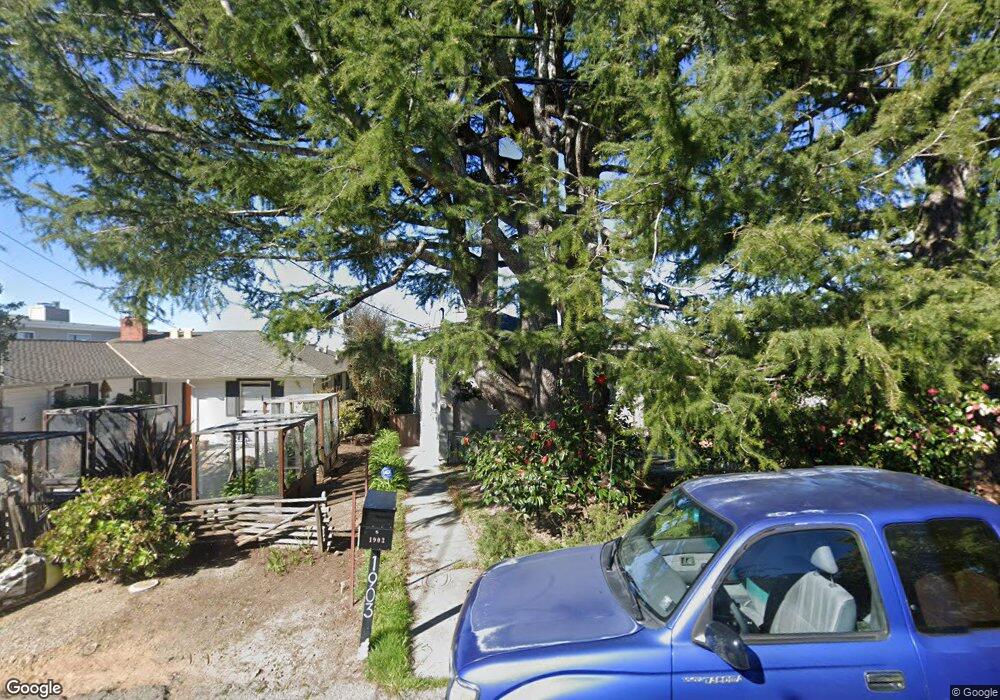
1903 Asilomar Dr Oakland, CA 94611
Montclair NeighborhoodEstimated Value: $1,323,000 - $1,642,000
3
Beds
2
Baths
1,700
Sq Ft
$871/Sq Ft
Est. Value
About This Home
This home is located at 1903 Asilomar Dr, Oakland, CA 94611 and is currently estimated at $1,480,475, approximately $870 per square foot. 1903 Asilomar Dr is a home located in Alameda County with nearby schools including Montclair Elementary School, Montera Middle School, and Skyline High School.
Ownership History
Date
Name
Owned For
Owner Type
Purchase Details
Closed on
Aug 20, 2018
Sold by
Yamamoto Miki Lynn
Bought by
Yamamoto Miki Lynn and The Miki Lynn Yamamoto Living
Current Estimated Value
Purchase Details
Closed on
Feb 13, 2018
Sold by
Concannon Richard H and Concannon Kathleen W
Bought by
Yamamoto Miki Lynn
Home Financials for this Owner
Home Financials are based on the most recent Mortgage that was taken out on this home.
Original Mortgage
$750,000
Outstanding Balance
$635,182
Interest Rate
3.99%
Mortgage Type
New Conventional
Estimated Equity
$845,293
Purchase Details
Closed on
Mar 1, 2004
Sold by
Hall Mark Allen and Dunnavant Joseph Thomas
Bought by
Concannon Richard H and Concannon Kathleen W
Home Financials for this Owner
Home Financials are based on the most recent Mortgage that was taken out on this home.
Original Mortgage
$738,400
Interest Rate
4.5%
Mortgage Type
Purchase Money Mortgage
Purchase Details
Closed on
May 6, 1999
Sold by
Boyd John Robert
Bought by
Hall Mark Allen and Dunnavant Joseph Thomas
Home Financials for this Owner
Home Financials are based on the most recent Mortgage that was taken out on this home.
Original Mortgage
$336,800
Interest Rate
6.86%
Create a Home Valuation Report for This Property
The Home Valuation Report is an in-depth analysis detailing your home's value as well as a comparison with similar homes in the area
Home Values in the Area
Average Home Value in this Area
Purchase History
| Date | Buyer | Sale Price | Title Company |
|---|---|---|---|
| Yamamoto Miki Lynn | -- | None Available | |
| Yamamoto Miki Lynn | $1,451,000 | Chicago Title Company | |
| Concannon Richard H | $923,000 | Fidelity National Title Co | |
| Hall Mark Allen | $421,000 | Chicago Title Co |
Source: Public Records
Mortgage History
| Date | Status | Borrower | Loan Amount |
|---|---|---|---|
| Open | Yamamoto Miki Lynn | $750,000 | |
| Previous Owner | Concannon Richard H | $738,400 | |
| Previous Owner | Hall Mark Allen | $336,800 | |
| Closed | Hall Mark Allen | $42,100 |
Source: Public Records
Tax History Compared to Growth
Tax History
| Year | Tax Paid | Tax Assessment Tax Assessment Total Assessment is a certain percentage of the fair market value that is determined by local assessors to be the total taxable value of land and additions on the property. | Land | Improvement |
|---|---|---|---|---|
| 2025 | $22,251 | $1,643,961 | $495,288 | $1,155,673 |
| 2024 | $22,251 | $1,611,590 | $485,577 | $1,133,013 |
| 2023 | $23,685 | $1,586,856 | $476,057 | $1,110,799 |
| 2022 | $23,074 | $1,548,747 | $466,724 | $1,089,023 |
| 2021 | $22,355 | $1,518,247 | $457,574 | $1,067,673 |
| 2020 | $22,113 | $1,509,620 | $452,886 | $1,056,734 |
| 2019 | $21,467 | $1,480,020 | $444,006 | $1,036,014 |
| 2018 | $16,945 | $1,153,306 | $345,992 | $807,314 |
| 2017 | $13,869 | $965,000 | $289,500 | $675,500 |
| 2016 | $12,985 | $900,000 | $270,000 | $630,000 |
| 2015 | $12,485 | $846,000 | $253,800 | $592,200 |
| 2014 | $12,255 | $800,000 | $240,000 | $560,000 |
Source: Public Records
Map
Nearby Homes
- 0 Colton Blvd
- 6425 Zinn Dr
- 1737 Alhambra Ln
- 5909 Colton Blvd
- 0 Woodrow Dr Unit 41109468
- 7580 Skyline Blvd
- 1801 Gouldin Rd
- 3 West Cir
- 6861 Saroni Dr
- 7030 Snake Rd
- 2066 Drake Dr
- 7116 Hemlock St
- 6050 Balboa Dr
- 6340 Shepherd Canyon Rd
- 7032 Sayre Dr
- 6687 Thornhill Dr
- 6210 Westover Dr
- 6338 Westover Dr
- 3 Westover Dr
- 2 Westover Dr
- 1909 Asilomar Dr
- 1901 Asilomar Dr
- 6468 Colton Blvd
- 1919 Asilomar Dr
- 6462 Colton Blvd
- 5519 Balboa Dr
- 6508 Saroni Dr
- 6456 Colton Blvd
- 1925 Asilomar Dr
- 5525 Balboa Dr
- 1908 Asilomar Dr
- 1916 Asilomar Dr
- 6450 Colton Blvd
- 1933 Asilomar Dr
- 5529 Balboa Dr
- 6507 Saroni Dr
- 1932 Asilomar Dr
- 6515 Saroni Dr
- 6522 Saroni Dr
- 1 Asilomar Cir