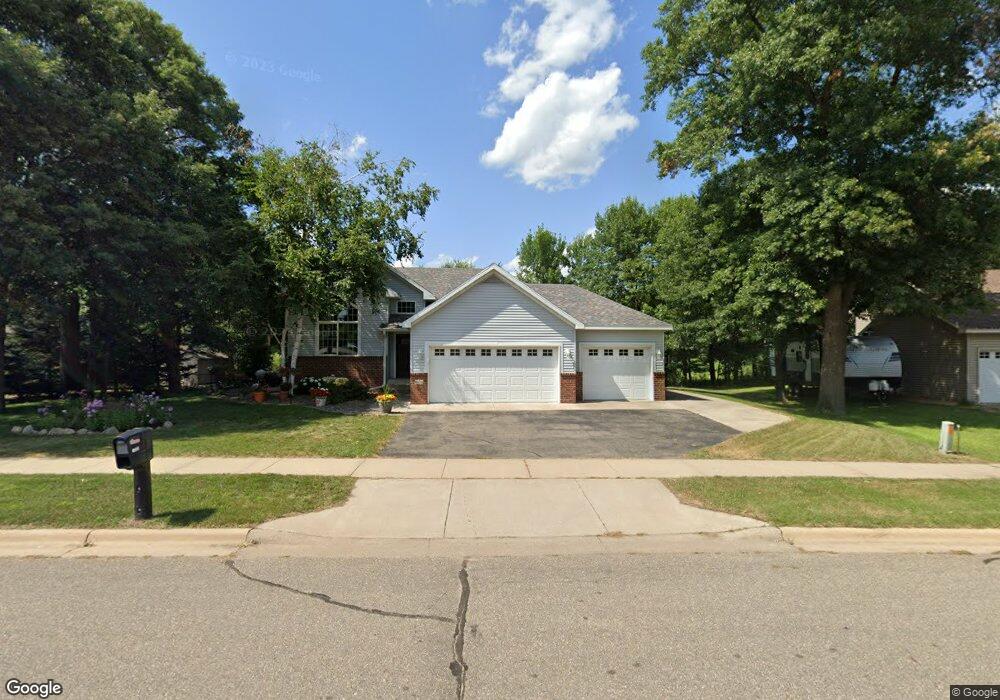
1903 Maple Ln Saint Cloud, MN 56304
Estimated Value: $285,000 - $341,000
3
Beds
2
Baths
1,718
Sq Ft
$178/Sq Ft
Est. Value
About This Home
This home is located at 1903 Maple Ln, Saint Cloud, MN 56304 and is currently estimated at $305,978, approximately $178 per square foot. 1903 Maple Ln is a home located in Benton County with nearby schools including Talahi Community Elementary School, South Junior High School, and St. Cloud Christian School.
Ownership History
Date
Name
Owned For
Owner Type
Purchase Details
Closed on
Oct 21, 2019
Sold by
Schmidt Darla L and Schmidt Joseph J
Bought by
Imdieke Sally
Current Estimated Value
Purchase Details
Closed on
Nov 2, 2016
Sold by
Barthel Shari and Graves Shari
Bought by
Schmidt Darla L and Schmidt Joseph J
Purchase Details
Closed on
Sep 16, 2013
Sold by
Sanford James W and Sanford Susan M
Bought by
Barthel Shari
Home Financials for this Owner
Home Financials are based on the most recent Mortgage that was taken out on this home.
Original Mortgage
$150,228
Interest Rate
4.37%
Mortgage Type
FHA
Purchase Details
Closed on
Mar 14, 2005
Sold by
Signature Homes Of Minnesota Inc
Bought by
Sanford James W
Home Financials for this Owner
Home Financials are based on the most recent Mortgage that was taken out on this home.
Original Mortgage
$151,120
Interest Rate
5.5%
Mortgage Type
Adjustable Rate Mortgage/ARM
Create a Home Valuation Report for This Property
The Home Valuation Report is an in-depth analysis detailing your home's value as well as a comparison with similar homes in the area
Purchase History
| Date | Buyer | Sale Price | Title Company |
|---|---|---|---|
| Imdieke Sally | $220,500 | Results Title | |
| Schmidt Darla L | -- | None Available | |
| Barthel Shari | $153,000 | Burnet Title | |
| Sanford James W | $195,982 | Minnesota Title And Escrow L |
Source: Public Records
Mortgage History
| Date | Status | Borrower | Loan Amount |
|---|---|---|---|
| Previous Owner | Barthel Shari | $150,228 | |
| Previous Owner | Sanford James W | $151,120 |
Source: Public Records
Tax History
| Year | Tax Paid | Tax Assessment Tax Assessment Total Assessment is a certain percentage of the fair market value that is determined by local assessors to be the total taxable value of land and additions on the property. | Land | Improvement |
|---|---|---|---|---|
| 2025 | $3,184 | $261,500 | $50,000 | $211,500 |
| 2024 | $3,224 | $251,400 | $50,000 | $201,400 |
| 2023 | $2,924 | $251,400 | $50,000 | $201,400 |
| 2022 | $2,632 | $223,600 | $50,000 | $173,600 |
| 2021 | $2,522 | $193,500 | $40,000 | $153,500 |
| 2018 | $2,236 | $148,700 | $39,223 | $109,477 |
| 2017 | $2,236 | $140,900 | $38,804 | $102,096 |
| 2016 | $2,114 | $153,600 | $45,000 | $108,600 |
| 2015 | $2,184 | $125,600 | $37,831 | $87,769 |
| 2014 | -- | $126,800 | $37,914 | $88,886 |
| 2013 | -- | $126,800 | $37,914 | $88,886 |
Source: Public Records
Map
Nearby Homes
- 1812 Maple Ln
- 1726 Woodland Rd
- 1708 Woodland Rd
- 555 Highway 10 S Unit 12
- 1526 14th St SE
- 1930 Prospect Dr NE
- 31 12th Ave NE
- 303 29th Ave SE
- 1202 11th Ave SE
- 358 29th Ave SE
- 1712 University Dr SE
- 464 30th Ave SE
- 1218 10th Ave SE
- 1020 8th Ave SE
- 1128 8th Ave SE
- 821 5th Ave SE
- 1537 12th Ave SE
- 116 Columbia Ave NE
- tbd 25th Ave NE
- 1810 11th Ave SE
- 1903 1903 Maple Ln
- 1907 Maple Ln
- 1825 Maple Ln
- 1906 Maple Ln
- 1821 Maple Ln
- 605 19th Ave SE
- 606 19th Ave SE
- 609 19th Ave SE
- 1820 Maple Ln
- 610 19th Ave SE
- 1816 Maple Ln
- 1809 Maple Ln
- 1834 Woodland Rd
- 614 19th Ave SE
- 617 19th Ave SE
- 1805 1805 Maple Ln
- 604 Oak Ct
- 601 Oak Ct
- 1830 Woodland Rd
- 1808 Maple Ln
Your Personal Tour Guide
Ask me questions while you tour the home.