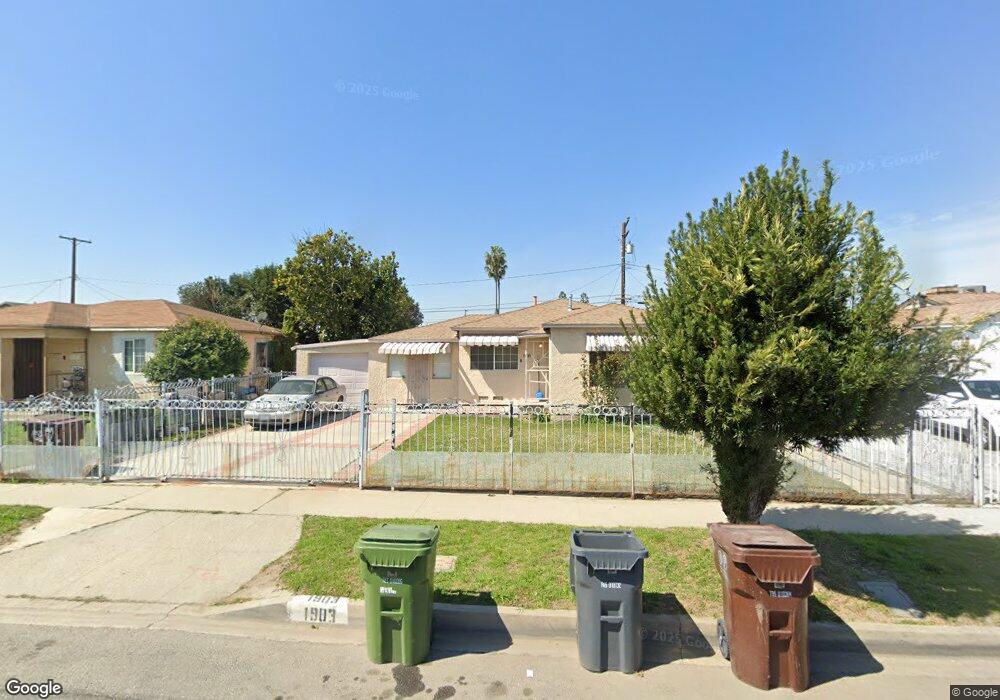
1903 N Grape Ave Compton, CA 90222
Estimated Value: $532,634 - $588,000
2
Beds
1
Bath
1,042
Sq Ft
$543/Sq Ft
Est. Value
About This Home
This home is located at 1903 N Grape Ave, Compton, CA 90222 and is currently estimated at $565,409, approximately $542 per square foot. 1903 N Grape Ave is a home located in Los Angeles County with nearby schools including Anderson Elementary School, Benjamin O. Davis Middle School, and Centennial High School.
Ownership History
Date
Name
Owned For
Owner Type
Purchase Details
Closed on
Dec 9, 2006
Sold by
Chaney Virgil
Bought by
Chaney Virgil and Chaney Nyece
Current Estimated Value
Home Financials for this Owner
Home Financials are based on the most recent Mortgage that was taken out on this home.
Original Mortgage
$103,000
Interest Rate
3.98%
Mortgage Type
New Conventional
Purchase Details
Closed on
Nov 24, 1993
Sold by
Murray Sallie Mae
Bought by
Chaney Virgil
Create a Home Valuation Report for This Property
The Home Valuation Report is an in-depth analysis detailing your home's value as well as a comparison with similar homes in the area
Home Values in the Area
Average Home Value in this Area
Purchase History
| Date | Buyer | Sale Price | Title Company |
|---|---|---|---|
| Chaney Virgil | -- | Wfg Title Company Of Ca | |
| Chaney Virgil | -- | None Available | |
| Chaney Virgil | -- | -- |
Source: Public Records
Mortgage History
| Date | Status | Borrower | Loan Amount |
|---|---|---|---|
| Previous Owner | Chaney Virgil | $103,000 |
Source: Public Records
Tax History
| Year | Tax Paid | Tax Assessment Tax Assessment Total Assessment is a certain percentage of the fair market value that is determined by local assessors to be the total taxable value of land and additions on the property. | Land | Improvement |
|---|---|---|---|---|
| 2025 | $1,462 | $37,684 | $18,601 | $19,083 |
| 2024 | $1,462 | $36,946 | $18,237 | $18,709 |
| 2023 | $1,553 | $36,223 | $17,880 | $18,343 |
| 2022 | $7,990 | $430,981 | $325,864 | $105,117 |
| 2021 | $1,135 | $34,819 | $17,187 | $17,632 |
| 2019 | $1,404 | $33,788 | $16,678 | $17,110 |
| 2018 | $1,322 | $33,126 | $16,351 | $16,775 |
| 2016 | $1,242 | $31,842 | $15,717 | $16,125 |
| 2015 | $1,208 | $31,364 | $15,481 | $15,883 |
| 2014 | $1,202 | $30,750 | $15,178 | $15,572 |
Source: Public Records
Map
Nearby Homes
- 1808 N Grape Ave
- 813 W Stockwell St
- 2207 N Anzac Ave
- 1608 N Grape Ave
- 720 W 137th St
- 2102 E Lucien St
- 2107 E Stockwell St
- 850 W 132nd St
- 2062 E Hatchway St
- 924 W 134th Place
- 701 W 139th St
- 1716 N Grandee Ave
- 0 W 134th Place
- 910 W 138th St
- 629 W Plum St
- 1036 W Stockwell St
- 720 W Cherry St
- 2223 E Oris St
- 521 W Cherry St
- 522 W Cherry St
- 1901 N Grape Ave
- 1819 N Grape Ave
- 1907 N Grape Ave
- 1900 N Anzac Ave
- 1815 N Grape Ave
- 1911 N Grape Ave
- 1816 N Anzac Ave
- 1904 N Anzac Ave
- 1812 N Anzac Ave
- 1908 N Anzac Ave
- 1900 N Grape Ave
- 1811 N Grape Ave
- 1915 N Grape Ave
- 1816 N Grape Ave
- 1904 N Grape Ave
- 1812 N Grape Ave
- 1808 N Anzac Ave
- 1908 N Grape Ave
- 1912 N Anzac Ave
- 1807 N Grape Ave
Your Personal Tour Guide
Ask me questions while you tour the home.