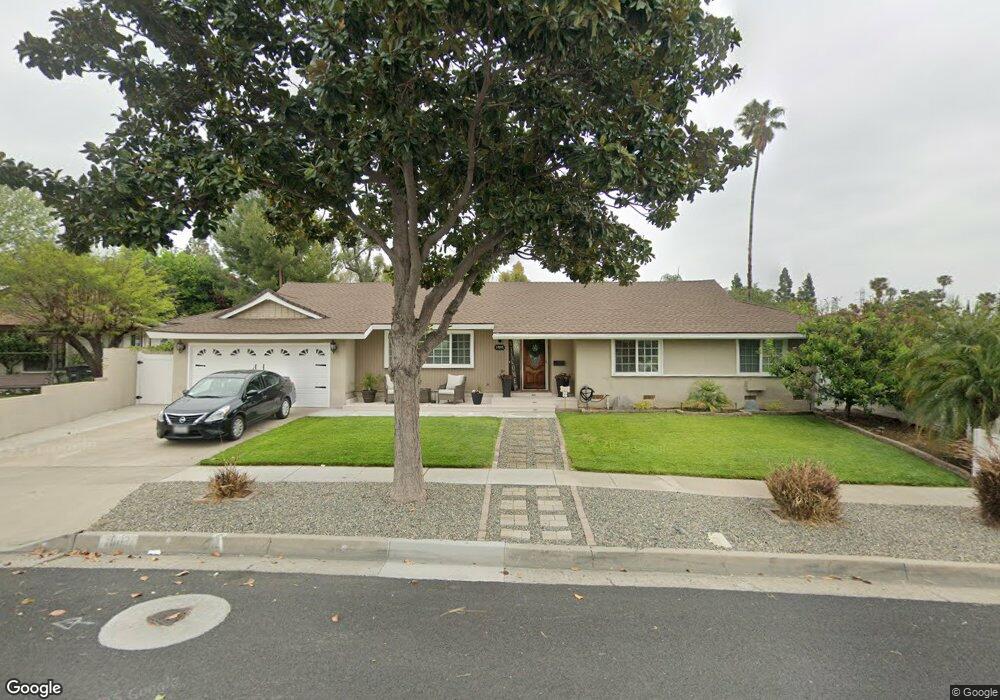
1903 N Greengrove St Orange, CA 92865
Estimated Value: $1,136,944 - $1,146,000
3
Beds
2
Baths
1,779
Sq Ft
$641/Sq Ft
Est. Value
About This Home
This home is located at 1903 N Greengrove St, Orange, CA 92865 and is currently estimated at $1,140,236, approximately $640 per square foot. 1903 N Greengrove St is a home located in Orange County with nearby schools including Taft Elementary School, Cerro Villa Middle School, and Villa Park High School.
Ownership History
Date
Name
Owned For
Owner Type
Purchase Details
Closed on
Jul 17, 2015
Sold by
Holland David W
Bought by
Ramsey Dianne and Stevenson Debra
Current Estimated Value
Purchase Details
Closed on
Apr 5, 2014
Sold by
Ramsey Dianne and Holland Dale R
Bought by
Adams Earnest Todd and Adams Jodi Lynn
Purchase Details
Closed on
Nov 27, 2013
Sold by
Ramsey Dianne and Stevenson Debra
Bought by
Ramsey Dianne and Holland Dale R
Purchase Details
Closed on
Mar 20, 2013
Sold by
Stevenson Debra
Bought by
Ramsey Dianne E
Purchase Details
Closed on
May 16, 2011
Sold by
Holland Zelma M
Bought by
Holland Zelma M and 2009 Zelma M Holland Revocable Trust
Purchase Details
Closed on
Aug 8, 1994
Sold by
Holland Willis L and Holland Zelma M
Bought by
Holland Willis L and Holland Zelma M
Create a Home Valuation Report for This Property
The Home Valuation Report is an in-depth analysis detailing your home's value as well as a comparison with similar homes in the area
Home Values in the Area
Average Home Value in this Area
Purchase History
| Date | Buyer | Sale Price | Title Company |
|---|---|---|---|
| Ramsey Dianne | -- | Fidelity National Title | |
| Adams Earnest Todd | -- | None Available | |
| Ramsey Dianne | -- | None Available | |
| Ramsey Dianne E | -- | None Available | |
| Ramsey Dianne E | -- | None Available | |
| Holland Zelma M | -- | None Available | |
| Holland Willis L | -- | -- |
Source: Public Records
Tax History Compared to Growth
Tax History
| Year | Tax Paid | Tax Assessment Tax Assessment Total Assessment is a certain percentage of the fair market value that is determined by local assessors to be the total taxable value of land and additions on the property. | Land | Improvement |
|---|---|---|---|---|
| 2025 | $5,814 | $530,139 | $419,688 | $110,451 |
| 2024 | $5,814 | $519,745 | $411,459 | $108,286 |
| 2023 | $5,683 | $509,554 | $403,391 | $106,163 |
| 2022 | $5,571 | $499,563 | $395,481 | $104,082 |
| 2021 | $5,415 | $489,768 | $387,726 | $102,042 |
| 2020 | $5,365 | $484,747 | $383,751 | $100,996 |
| 2019 | $5,297 | $475,243 | $376,227 | $99,016 |
| 2018 | $5,215 | $465,925 | $368,850 | $97,075 |
| 2017 | $4,999 | $456,790 | $361,618 | $95,172 |
| 2016 | $4,902 | $447,834 | $354,528 | $93,306 |
| 2015 | $4,829 | $441,108 | $349,203 | $91,905 |
| 2014 | $2,908 | $249,400 | $179,726 | $69,674 |
Source: Public Records
Map
Nearby Homes
- 2074 N Highland St
- 1232 E Chestnut Ave
- 1931 E Meats Ave Unit 146
- 1931 E Meats Ave Unit 14
- 626 E Palmdale Ave
- 2295 N Tustin St Unit 84
- 1540 E Trenton Ave Unit 124A
- 1540 E Trenton Ave Unit 79
- 1540 E Trenton Ave Unit 33
- 1540 E Trenton Ave Unit 34
- 1046 E Trenton Ave
- 2152 N Cleveland St
- 1232 E Vanowen Ave
- 336 E Briardale Ave Unit 3
- 1631 N Shaffer St
- 2117 N Orange Olive Rd
- 2504 N Bourbon St
- 1972 N Fern St
- 2525 N Bourbon St Unit E2
- 1201 E Saint James Ave
- 1907 N Greengrove St
- 1898 N Lincoln St
- 1891 N Greengrove St
- 1892 N Lincoln St
- 1910 N Greengrove St
- 1911 N Greengrove St
- 1879 N Greengrove St
- 1892 N Greengrove St
- 1880 N Lincoln St
- 1880 N Greengrove St
- 1915 N Greengrove St
- 1907 N Ebonywood St
- 1974 N Lincoln St
- 1917 N Ebonywood St
- 1867 N Greengrove St
- 1891 N Lincoln St
- 1868 N Lincoln St
- 1972 N Lincoln St
- 1968 N Lincoln St
- 1893 N Ebonywood St