
Seller's Agent in 2012
Sharon Hughey
Hughey & Neuman, Inc.
(229) 881-3618
1 Total Sale
Estimated Value: $191,255 - $211,000
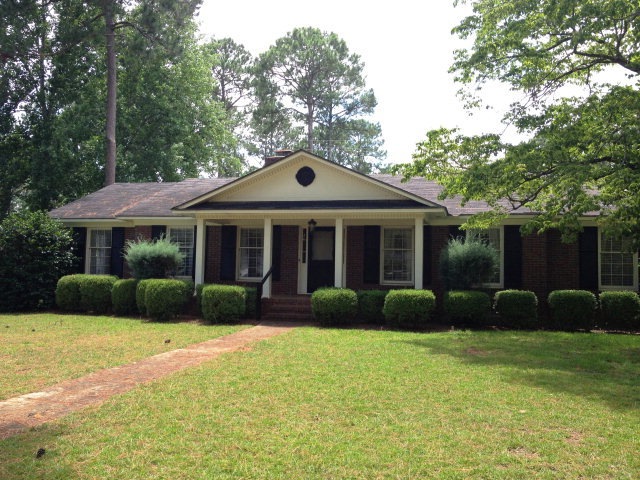
Perfect starter home or downsizer! This house is clean and ready to make it your own. Also this home is walking distance to Lake Park School and Westover High School. Perfect timing for the new school year. The spacious kitchen is open and has a center island for additional storage or prep area. The house includes plantation blinds, ceiling fans, wood burning fireplace, built-ins in den, hardwood floors, ceramic tile in kitchen and baths, kitchen appliances including refrigerator, smooth top cooktop, dishwasher, wall oven, and even a washer and dryer. The backyard has a fence yard, open patio,storage, and a carport. Call now for a preview of this great house all for $117,900!
Last Agent to Sell the Property
Hughey & Neuman, Inc. Brokerage Phone: 2294360212 License #113599 Listed on: 07/19/2012
| Date | Buyer | Sale Price | Title Company |
|---|---|---|---|
| Thomas Richard | $92,500 | -- | |
| Fulmer Robert Neal | -- | -- | |
| Fulmer Mary Catherine | $125,000 | -- | |
| Cold Marty F | $110,900 | -- | |
| King Terry A | $101,900 | -- | |
| Holcombe Anita Dale | $89,000 | -- | |
| Holloway Albert | $89,000 | -- | |
| Holloway Hildreth | -- | -- |
| Date | Event | Price | List to Sale | Price per Sq Ft |
|---|---|---|---|---|
| 08/09/2012 08/09/12 | Sold | $92,500 | -- | $51 / Sq Ft |
| 07/19/2012 07/19/12 | Pending | -- | -- | -- |
| Year | Tax Paid | Tax Assessment Tax Assessment Total Assessment is a certain percentage of the fair market value that is determined by local assessors to be the total taxable value of land and additions on the property. | Land | Improvement |
|---|---|---|---|---|
| 2024 | $1,813 | $38,000 | $8,080 | $29,920 |
| 2023 | $1,770 | $38,000 | $8,080 | $29,920 |
| 2022 | $1,777 | $38,000 | $8,080 | $29,920 |
| 2021 | $1,647 | $38,000 | $8,080 | $29,920 |
| 2020 | $1,651 | $38,000 | $8,080 | $29,920 |
| 2019 | $1,658 | $38,000 | $8,080 | $29,920 |
| 2018 | $1,665 | $38,000 | $8,080 | $29,920 |
| 2017 | $1,551 | $38,000 | $8,080 | $29,920 |
| 2016 | $1,567 | $38,000 | $8,080 | $29,920 |
| 2015 | $1,849 | $45,160 | $8,080 | $37,080 |
| 2014 | $2,175 | $53,800 | $10,120 | $43,680 |
Seller's Agent in 2012
Sharon Hughey
Hughey & Neuman, Inc.
(229) 881-3618
1 Total Sale
Buyer's Agent in 2012
KATIE HUGHEY GATEWOOD
Hughey & Neuman, Inc.
(229) 881-0743
23 in this area
249 Total Sales
Source: Albany Board of REALTORS®
MLS Number: 126879
APN: 0000P-00018-011