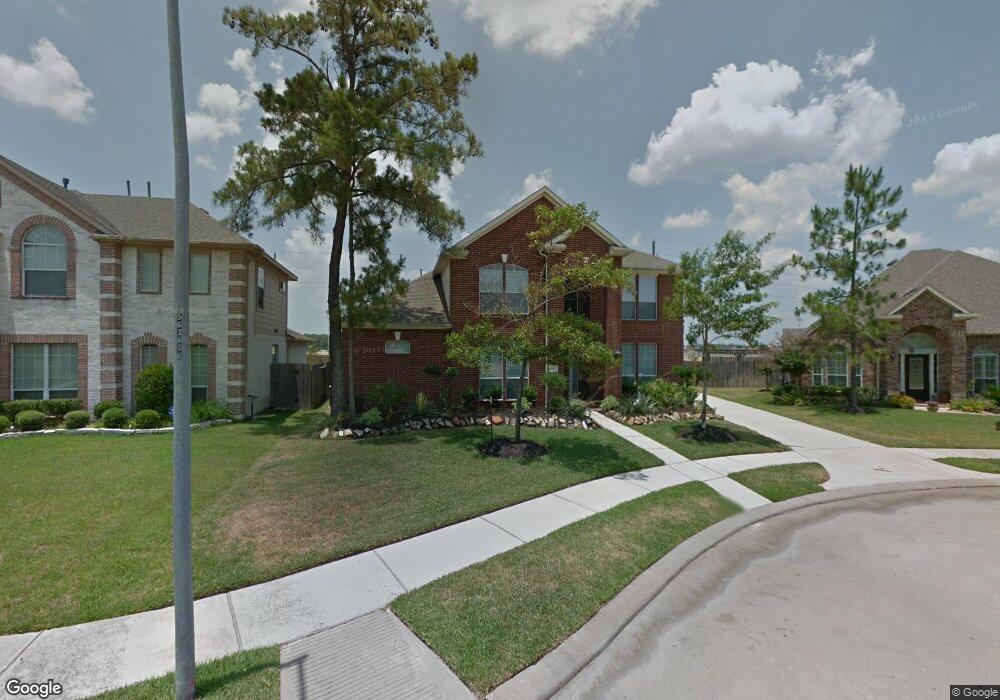
19031 Rustling Ridge Ln Tomball, TX 77377
Northpointe NeighborhoodEstimated Value: $450,300 - $486,000
4
Beds
3
Baths
3,266
Sq Ft
$145/Sq Ft
Est. Value
About This Home
This home is located at 19031 Rustling Ridge Ln, Tomball, TX 77377 and is currently estimated at $473,325, approximately $144 per square foot. 19031 Rustling Ridge Ln is a home located in Harris County with nearby schools including Canyon Pointe Elementary School, Oakcrest Intermediate School, and Tomball Memorial High School.
Ownership History
Date
Name
Owned For
Owner Type
Purchase Details
Closed on
Aug 22, 2006
Sold by
Aurora Loan Services Llc
Bought by
Shoemaker Jeffery and Shoemaker Leslie
Current Estimated Value
Home Financials for this Owner
Home Financials are based on the most recent Mortgage that was taken out on this home.
Original Mortgage
$156,000
Outstanding Balance
$93,609
Interest Rate
6.75%
Mortgage Type
Purchase Money Mortgage
Estimated Equity
$379,716
Purchase Details
Closed on
Apr 4, 2006
Sold by
Mortgage Electronic Registration Systems
Bought by
Aurora Loan Services Llc
Purchase Details
Closed on
Nov 30, 2004
Sold by
Imperial Homes Texas Ltd
Bought by
Ditta Frank P
Home Financials for this Owner
Home Financials are based on the most recent Mortgage that was taken out on this home.
Original Mortgage
$177,561
Interest Rate
7%
Mortgage Type
Purchase Money Mortgage
Create a Home Valuation Report for This Property
The Home Valuation Report is an in-depth analysis detailing your home's value as well as a comparison with similar homes in the area
Home Values in the Area
Average Home Value in this Area
Purchase History
| Date | Buyer | Sale Price | Title Company |
|---|---|---|---|
| Shoemaker Jeffery | -- | Fidelity National Title | |
| Aurora Loan Services Llc | -- | None Available | |
| Mortgage Electronic Registration Systems | $200,516 | None Available | |
| Ditta Frank P | -- | Stewart Title Houston Div |
Source: Public Records
Mortgage History
| Date | Status | Borrower | Loan Amount |
|---|---|---|---|
| Open | Shoemaker Jeffery | $156,000 | |
| Previous Owner | Ditta Frank P | $177,561 | |
| Closed | Ditta Frank P | $33,292 |
Source: Public Records
Tax History Compared to Growth
Tax History
| Year | Tax Paid | Tax Assessment Tax Assessment Total Assessment is a certain percentage of the fair market value that is determined by local assessors to be the total taxable value of land and additions on the property. | Land | Improvement |
|---|---|---|---|---|
| 2025 | $7,870 | $452,028 | $83,799 | $368,229 |
| 2024 | $7,870 | $409,868 | $82,447 | $327,421 |
| 2023 | $7,870 | $451,099 | $82,447 | $368,652 |
| 2022 | $8,317 | $350,000 | $72,085 | $277,915 |
| 2021 | $7,896 | $282,348 | $58,569 | $223,779 |
| 2020 | $8,095 | $290,460 | $58,569 | $231,891 |
| 2019 | $8,154 | $270,584 | $51,811 | $218,773 |
| 2018 | $3,229 | $265,936 | $51,811 | $214,125 |
| 2017 | $8,119 | $265,936 | $51,811 | $214,125 |
| 2016 | $8,311 | $280,000 | $51,811 | $228,189 |
| 2015 | $6,966 | $288,322 | $51,811 | $236,511 |
| 2014 | $6,966 | $225,000 | $39,647 | $185,353 |
Source: Public Records
Map
Nearby Homes
- 19026 Rustling Ridge Ln
- 19006 Rustling Ridge Ln
- 12719 Rocky Briar Ln
- 12610 Baldwin Springs Ct
- 18903 Danbridge Ct
- 12623 Ember Village Ln
- 18803 Dusty Rose Ln
- 14111 Boudreaux Rd
- 12427 Point Arbor Ct
- 18914 Hamish Rd
- 18931 Winding Atwood Ln
- 19023 Wild Thornberry Dr
- 12918 Chatfield Manor Ln
- 18814 Emery Meadows Ln
- 12414 Montebello Manor Ln
- 13522 Carrill Bend Ln
- 18603 Bridle Grove Ct
- 18522 Cascade Timbers Ln
- 18703 Summercliff Ln
- 18402 Sierra Falls Ct
- 19027 Rustling Ridge Ln
- 12822 Stanbury Park Ln
- 19023 Rustling Ridge Ln
- 12818 Stanbury Park Ln
- 19026 Rustling Ridge Dr
- 12814 Stanbury Park Ln
- 19019 Rustling Ridge Ln
- 19022 Rustling Ridge Dr
- 12835 Madera Canyon Ln
- 19022 Rustling Ridge Ln
- 19018 Rustling Ridge Dr
- 19018 Rustling Ridge Ln
- 12831 Madera Canyon Ln
- 19103 Austin Bluff Ln
- 12810 Stanbury Park Ln
- 19015 Rustling Ridge Ln
- 12811 Stanbury Park Ln
- 19014 Rustling Ridge Dr
- 12827 Madera Canyon Ln
- 19014 Rustling Ridge Ln