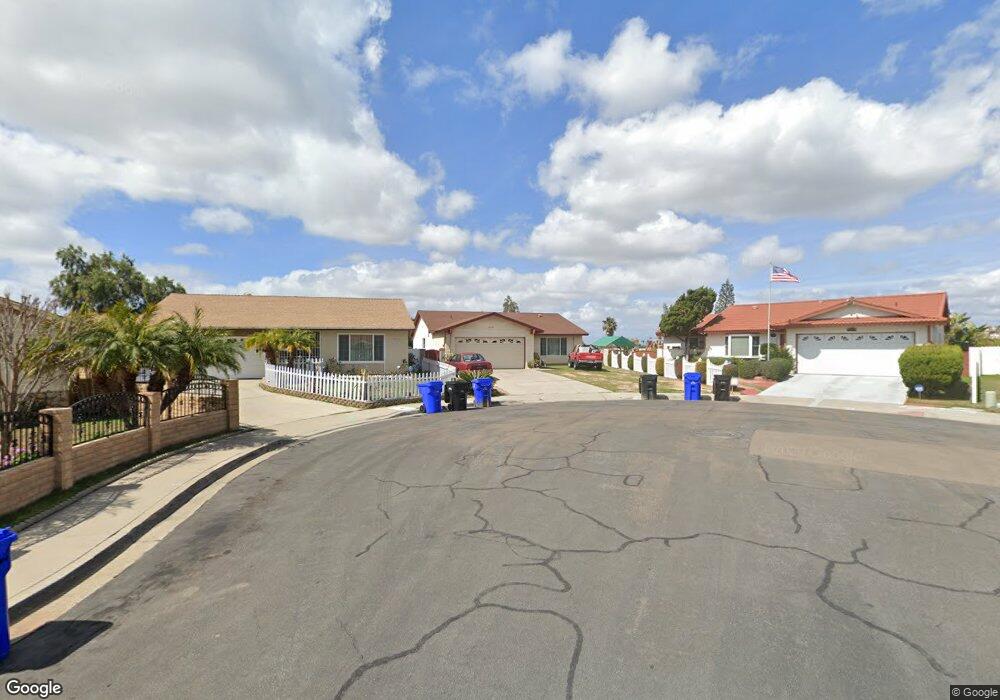
1904 Altamont Place San Diego, CA 92139
Paradise Hills NeighborhoodEstimated Value: $739,000 - $813,000
3
Beds
2
Baths
1,818
Sq Ft
$435/Sq Ft
Est. Value
About This Home
This home is located at 1904 Altamont Place, San Diego, CA 92139 and is currently estimated at $790,180, approximately $434 per square foot. 1904 Altamont Place is a home located in San Diego County with nearby schools including Paradise Hills Elementary School, Bell Middle School, and Morse High School.
Ownership History
Date
Name
Owned For
Owner Type
Purchase Details
Closed on
Oct 25, 2022
Sold by
Tarnate John N and Tarnate Elvira B
Bought by
Tarnate Family Trust and Tarnate
Current Estimated Value
Purchase Details
Closed on
Oct 11, 2002
Sold by
Tarnate Elvira B
Bought by
Tarnate John N and Tarnate Elvira B
Home Financials for this Owner
Home Financials are based on the most recent Mortgage that was taken out on this home.
Original Mortgage
$221,250
Interest Rate
6.05%
Purchase Details
Closed on
Jul 30, 1998
Sold by
Cayas Bernardo H and Cayas Evelyn A
Bought by
Cayas Bernardo Hilario and Cayas Evelyn Amores
Home Financials for this Owner
Home Financials are based on the most recent Mortgage that was taken out on this home.
Original Mortgage
$131,750
Interest Rate
10.75%
Purchase Details
Closed on
May 23, 1997
Sold by
Cayas Bernardo H and Cayas Evelyn A
Bought by
Cayas Bernardo Hilario and Cayas Evelyn Amores
Purchase Details
Closed on
Apr 13, 1993
Purchase Details
Closed on
Jun 15, 1988
Create a Home Valuation Report for This Property
The Home Valuation Report is an in-depth analysis detailing your home's value as well as a comparison with similar homes in the area
Home Values in the Area
Average Home Value in this Area
Purchase History
| Date | Buyer | Sale Price | Title Company |
|---|---|---|---|
| Tarnate Family Trust | -- | None Listed On Document | |
| Tarnate John N | -- | American Title Co | |
| Cayas Bernardo Hilario | -- | Chicago Title Co | |
| Cayas Bernardo Hilario | -- | Stewart Title Company | |
| -- | $55,000 | -- | |
| -- | $108,000 | -- |
Source: Public Records
Mortgage History
| Date | Status | Borrower | Loan Amount |
|---|---|---|---|
| Previous Owner | Tarnate John N | $221,250 | |
| Previous Owner | Cayas Bernardo Hilario | $131,750 |
Source: Public Records
Tax History Compared to Growth
Tax History
| Year | Tax Paid | Tax Assessment Tax Assessment Total Assessment is a certain percentage of the fair market value that is determined by local assessors to be the total taxable value of land and additions on the property. | Land | Improvement |
|---|---|---|---|---|
| 2025 | $4,955 | $415,792 | $132,943 | $282,849 |
| 2024 | $4,955 | $407,640 | $130,337 | $277,303 |
| 2023 | $4,844 | $399,648 | $127,782 | $271,866 |
| 2022 | $4,714 | $391,813 | $125,277 | $266,536 |
| 2021 | $4,680 | $384,131 | $122,821 | $261,310 |
| 2020 | $4,622 | $380,193 | $121,562 | $258,631 |
| 2019 | $3,258 | $268,818 | $119,179 | $149,639 |
| 2018 | $3,046 | $263,548 | $116,843 | $146,705 |
| 2017 | $2,972 | $258,381 | $114,552 | $143,829 |
| 2016 | $2,922 | $253,315 | $112,306 | $141,009 |
| 2015 | $2,878 | $249,511 | $110,620 | $138,891 |
| 2014 | $2,832 | $244,625 | $108,454 | $136,171 |
Source: Public Records
Map
Nearby Homes
- 5756 Midwick St
- 751 Paradise Way
- 1504 Euclid Ave
- 2220 Rachael Ave
- 3600 Paradise Valley Rd
- 2245 S Lanoitan Ave
- 3625 Peach Blossom St
- 307 S Belmont Ave
- 2125 Prospect St
- 2016 E 10th St
- 2320 Euclid Ave Unit 1
- 2579 Reo Dr
- 0 Ridgeway Dr Unit PTP2501261
- 1876 E 12th St
- 4021 Cherry Blossom St
- 2877 Ridgeway Dr
- 1843 E 16th St
- 5720 Greycourt Ave
- 1741 E 16th St Unit R
- 6127 Winchester St
- 1918 Altamont Place
- 1905 Altamont Place
- 1844 Reo Dr
- 1834 Reo Dr
- 1854 Reo Dr
- 1932 Altamont Place
- 1919 Altamont Place
- 1335 S Harbison Ave
- 1325 S Harbison Ave
- 1864 Reo Dr
- 1933 Altamont Place
- 1946 Altamont Place
- 1405 S Harbison Ave
- 1315 S Harbison Ave
- 1947 Altamont Place
- 1874 Reo Dr
- 1960 Altamont Place
- 1415 S Harbison Ave
- 1961 Altamont Place
- 1928 Olive Ave