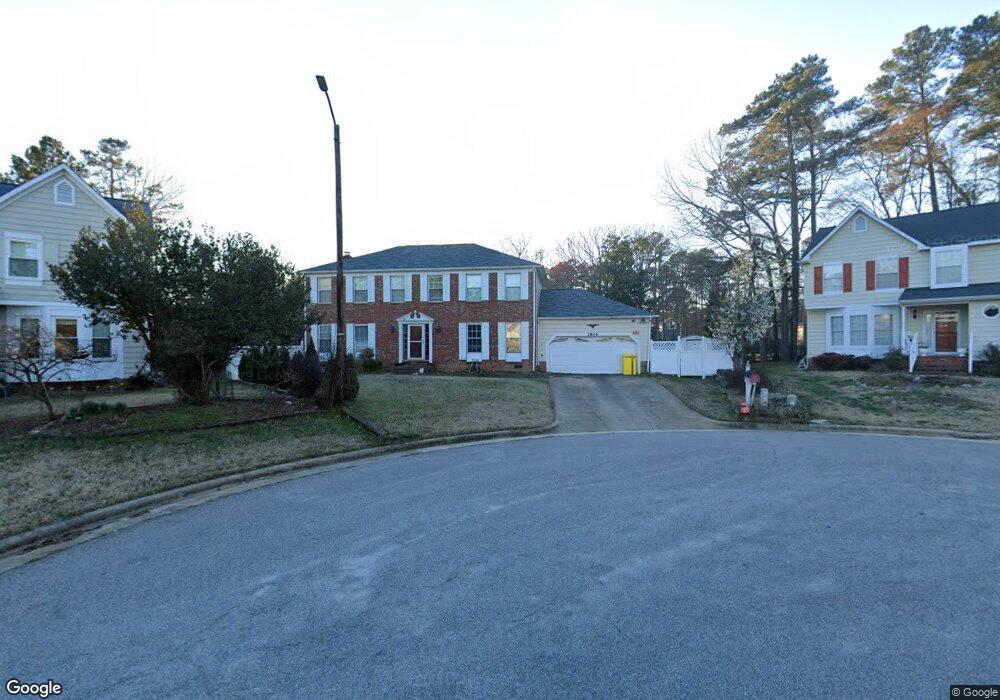
1904 Grove Point Ct Raleigh, NC 27609
Estimated Value: $499,000 - $658,389
5
Beds
3
Baths
2,464
Sq Ft
$240/Sq Ft
Est. Value
About This Home
This home is located at 1904 Grove Point Ct, Raleigh, NC 27609 and is currently estimated at $590,347, approximately $239 per square foot. 1904 Grove Point Ct is a home located in Wake County with nearby schools including Millbrook Elementary School, East Millbrook Middle, and Millbrook High School.
Ownership History
Date
Name
Owned For
Owner Type
Purchase Details
Closed on
Apr 25, 2024
Sold by
Tu Susan and Tran Alexander
Bought by
Tran Alexander
Current Estimated Value
Purchase Details
Closed on
Aug 11, 2022
Sold by
Tu and Alexander
Bought by
Tu Susan and Tran Alexander
Purchase Details
Closed on
May 10, 2021
Sold by
Tu Susan
Bought by
Tu Tran Beauty Holdings Llc
Purchase Details
Closed on
Dec 27, 2012
Sold by
Federal National Mortgage Association
Bought by
Tu Susan
Purchase Details
Closed on
Jan 10, 2012
Sold by
Alonzo Mario H and Alonzo Barbara A
Bought by
Federal Home Loan Mortgage Corporation
Purchase Details
Closed on
Oct 25, 2005
Sold by
Mistry Aban N
Bought by
Alonzo Mario H and Alonzo Barbara A
Home Financials for this Owner
Home Financials are based on the most recent Mortgage that was taken out on this home.
Original Mortgage
$220,000
Interest Rate
5.71%
Mortgage Type
Fannie Mae Freddie Mac
Create a Home Valuation Report for This Property
The Home Valuation Report is an in-depth analysis detailing your home's value as well as a comparison with similar homes in the area
Home Values in the Area
Average Home Value in this Area
Purchase History
| Date | Buyer | Sale Price | Title Company |
|---|---|---|---|
| Tran Alexander | -- | None Listed On Document | |
| Tu Susan | -- | None Listed On Document | |
| Tu Tran Beauty Holdings Llc | -- | None Listed On Document | |
| Tu Susan | -- | None Available | |
| Federal Home Loan Mortgage Corporation | $185,600 | None Available | |
| Alonzo Mario H | $220,000 | None Available |
Source: Public Records
Mortgage History
| Date | Status | Borrower | Loan Amount |
|---|---|---|---|
| Previous Owner | Alonzo Mario H | $220,000 |
Source: Public Records
Tax History Compared to Growth
Tax History
| Year | Tax Paid | Tax Assessment Tax Assessment Total Assessment is a certain percentage of the fair market value that is determined by local assessors to be the total taxable value of land and additions on the property. | Land | Improvement |
|---|---|---|---|---|
| 2025 | $4,985 | $569,272 | $200,000 | $369,272 |
| 2024 | $4,964 | $569,272 | $200,000 | $369,272 |
| 2023 | $3,896 | $355,611 | $110,000 | $245,611 |
| 2022 | $3,621 | $355,611 | $110,000 | $245,611 |
| 2021 | $3,480 | $355,611 | $110,000 | $245,611 |
| 2020 | $3,417 | $355,611 | $110,000 | $245,611 |
| 2019 | $3,092 | $265,053 | $78,000 | $187,053 |
| 2018 | $2,916 | $265,053 | $78,000 | $187,053 |
| 2017 | $2,777 | $265,053 | $78,000 | $187,053 |
| 2016 | -- | $265,053 | $78,000 | $187,053 |
| 2015 | $2,419 | $231,649 | $68,000 | $163,649 |
| 2014 | $2,294 | $231,649 | $68,000 | $163,649 |
Source: Public Records
Map
Nearby Homes
- 1524 Edgeside Ct
- 1707 Falls Church Rd
- 1717 Falls Church Rd
- 5812 Old Forge Cir
- 1516 Hemphill Dr
- 5718 Sentinel Dr
- 6309 Johnsdale Rd
- 5721 Timber Ridge Dr
- 6504 Jade Tree Ln
- 5810 Shady Grove Cir
- 1700 Pony Run Rd
- 1401 Spring Forest Rd
- 6311 Johnsdale Rd
- 6844 Greystone Dr
- 6016 Volant Dr
- 6904 Aspen Ct
- 1220 Manassas Ct Unit B
- 6805 Greystone Dr
- 5804 Falls of Neuse Rd Unit E
- 1776 Quail Ridge Rd
- 1908 Grove Point Ct
- 1900 Grove Point Ct
- 1912 Grove Point Ct
- 6038 Sentinel Dr
- 6023 Sentinel Dr
- 6025 Sentinel Dr
- 1901 Grove Point Ct
- 6019 Sentinel Dr
- 1905 Grove Point Ct
- 1913 Grove Point Ct
- 1909 Grove Point Ct
- 1905 Summerlyn Ct
- 6021 Sentinel Dr
- 6040 Sentinel Dr
- 2217 Heathrowe Place
- 2217 Heathrow Place
- 6027 Sentinel Dr
- 1901 Summerlyn Ct
- 6017 Sentinel Dr
- 6026 Sentinel Dr