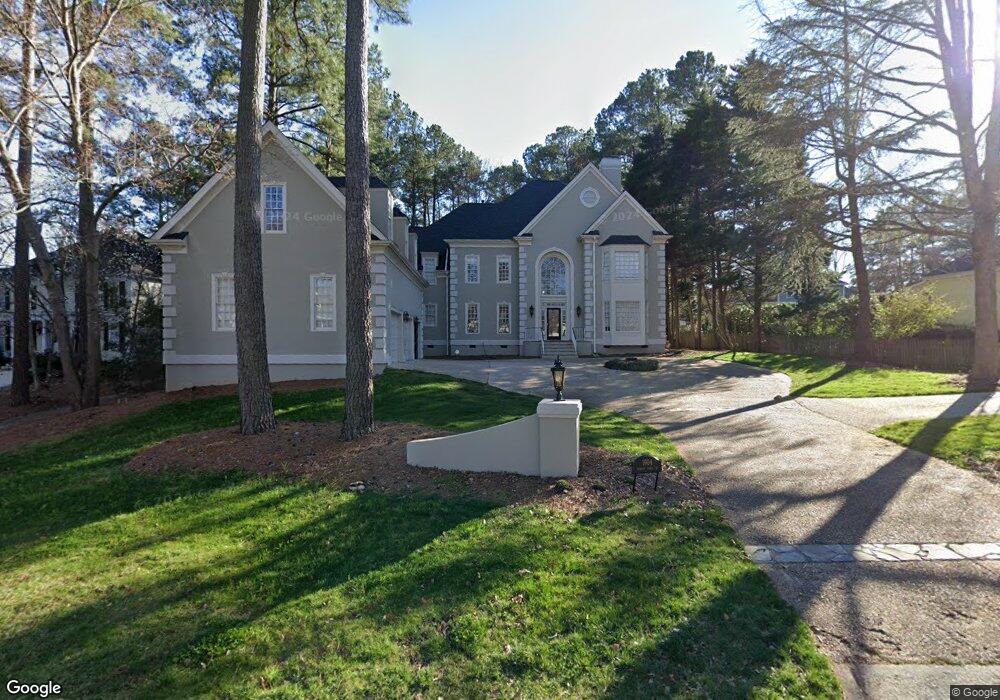
1904 Torrey Pines Place Raleigh, NC 27615
Estimated Value: $1,310,000 - $2,088,000
5
Beds
5
Baths
6,476
Sq Ft
$268/Sq Ft
Est. Value
About This Home
This home is located at 1904 Torrey Pines Place, Raleigh, NC 27615 and is currently estimated at $1,733,104, approximately $267 per square foot. 1904 Torrey Pines Place is a home located in Wake County with nearby schools including North Ridge Elementary School, West Millbrook Middle School, and Millbrook High School.
Ownership History
Date
Name
Owned For
Owner Type
Purchase Details
Closed on
Mar 16, 2017
Sold by
Matthews John L
Bought by
Baker Brian and Baker Maureen
Current Estimated Value
Home Financials for this Owner
Home Financials are based on the most recent Mortgage that was taken out on this home.
Original Mortgage
$548,000
Outstanding Balance
$454,683
Interest Rate
4.19%
Mortgage Type
New Conventional
Estimated Equity
$1,278,421
Purchase Details
Closed on
Nov 10, 2004
Sold by
Cole Richard H and Cole Susan S
Bought by
Cole Susan S
Purchase Details
Closed on
Oct 24, 2001
Sold by
Cole Richard H and Cole Susan S
Bought by
Cole Susan S
Purchase Details
Closed on
Jun 19, 1997
Bought by
Cole, Susan S Trustee
Create a Home Valuation Report for This Property
The Home Valuation Report is an in-depth analysis detailing your home's value as well as a comparison with similar homes in the area
Home Values in the Area
Average Home Value in this Area
Purchase History
| Date | Buyer | Sale Price | Title Company |
|---|---|---|---|
| Baker Brian | $685,000 | None Available | |
| Cole Susan S | -- | -- | |
| Cole Susan S | -- | -- | |
| Cole Susan S | -- | -- | |
| Cole, Susan S Trustee | $540,000 | -- |
Source: Public Records
Mortgage History
| Date | Status | Borrower | Loan Amount |
|---|---|---|---|
| Open | Baker Brian | $548,000 |
Source: Public Records
Tax History Compared to Growth
Tax History
| Year | Tax Paid | Tax Assessment Tax Assessment Total Assessment is a certain percentage of the fair market value that is determined by local assessors to be the total taxable value of land and additions on the property. | Land | Improvement |
|---|---|---|---|---|
| 2025 | $11,916 | $1,364,080 | $480,000 | $884,080 |
| 2024 | $11,867 | $1,364,080 | $480,000 | $884,080 |
| 2023 | $10,781 | $987,263 | $231,250 | $756,013 |
| 2022 | $10,016 | $987,263 | $231,250 | $756,013 |
| 2021 | $9,626 | $987,263 | $231,250 | $756,013 |
| 2020 | $9,450 | $987,263 | $231,250 | $756,013 |
| 2019 | $10,457 | $900,621 | $218,750 | $681,871 |
| 2018 | $9,860 | $900,621 | $218,750 | $681,871 |
| 2017 | $9,389 | $900,621 | $218,750 | $681,871 |
| 2016 | $8,490 | $831,408 | $218,750 | $612,658 |
| 2015 | $9,852 | $949,486 | $306,250 | $643,236 |
| 2014 | $9,342 | $949,486 | $306,250 | $643,236 |
Source: Public Records
Map
Nearby Homes
- 7404 Rainwater Rd
- 7516 Wingfoot Dr
- 2216 Gresham Lake Rd
- 7620 Rainwater Rd
- 1904 Merion Place
- 2105 Prescott Place
- 8621 Swarthmore Dr
- 8800 Harps Mill Rd
- 7140 N Ridge Dr
- 7316 Massachusetts Ct
- 1925 Hunting Ridge Rd
- 2301 Declaration Dr
- 2317 Declaration Dr
- 2509 Goudy Dr
- 1820 Hunting Ridge Rd
- 1620 Hunting Ridge Rd
- 7924 Hardwick Dr
- 8324 Bellingham Cir
- 1616 Hunting Ridge Rd
- 2328 Florida Ct
- 1912 Torrey Pines Place
- 1900 Torrey Pines Place
- 7504 Rainwater Rd
- 1916 Torrey Pines Place
- 7500 Rainwater Rd
- 1909 Torrey Pines Place
- 1905 Torrey Pines Place
- 2005 Malvern Ct
- 7512 Rainwater Rd
- 1913 Torrey Pines Place
- 7412 Rainwater Rd
- 1920 Torrey Pines Place
- 2001 Malvern Ct
- 1805 Dunes Ct
- 7505 Rainwater Rd
- 1917 Torrey Pines Place
- 7516 Rainwater Rd
- 2009 Malvern Ct
- 2104 Gresham Lake Rd
- 2108 Gresham Lake Rd