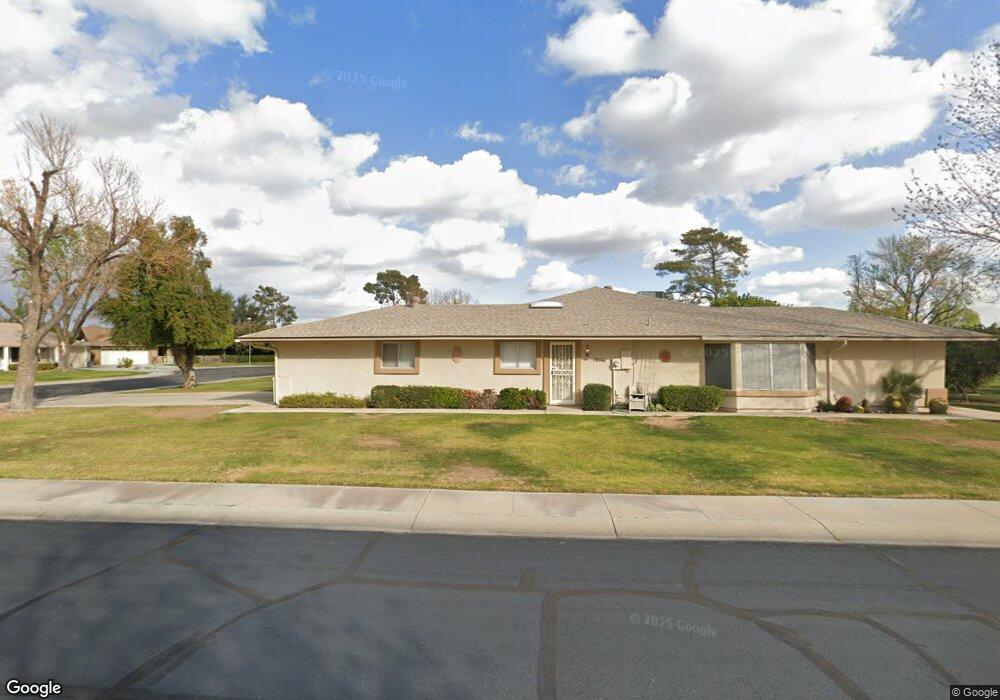
19041 N Lake Forest Dr Sun City, AZ 85373
Estimated Value: $247,780 - $425,000
2
Beds
2
Baths
1,936
Sq Ft
$175/Sq Ft
Est. Value
About This Home
This home is located at 19041 N Lake Forest Dr, Sun City, AZ 85373 and is currently estimated at $338,195, approximately $174 per square foot. 19041 N Lake Forest Dr is a home located in Maricopa County with nearby schools including Parkridge Elementary School, Sunrise Mountain High School, and Sonoran Science Academy-Peoria.
Ownership History
Date
Name
Owned For
Owner Type
Purchase Details
Closed on
Oct 28, 2022
Sold by
Barr Donna J
Bought by
Barr Donna J and Robinson Linda Lou
Current Estimated Value
Purchase Details
Closed on
Nov 10, 2008
Sold by
Brown Dorothy M
Bought by
Barr Rollin D and Barr Donna J
Purchase Details
Closed on
Dec 14, 1998
Sold by
Norwest Bank Arizona Na
Bought by
Brown Howard R and Brown Dorothy M
Home Financials for this Owner
Home Financials are based on the most recent Mortgage that was taken out on this home.
Original Mortgage
$104,706
Interest Rate
6.77%
Mortgage Type
Purchase Money Mortgage
Purchase Details
Closed on
Jul 8, 1998
Sold by
Norwest Bank Arizona Na
Bought by
Offerman Geneva R
Home Financials for this Owner
Home Financials are based on the most recent Mortgage that was taken out on this home.
Original Mortgage
$60,000
Interest Rate
7.03%
Create a Home Valuation Report for This Property
The Home Valuation Report is an in-depth analysis detailing your home's value as well as a comparison with similar homes in the area
Home Values in the Area
Average Home Value in this Area
Purchase History
| Date | Buyer | Sale Price | Title Company |
|---|---|---|---|
| Barr Donna J | -- | None Listed On Document | |
| Barr Rollin D | $160,000 | First American Title Ins Co | |
| Brown Howard R | $115,000 | First American Title | |
| Offerman Geneva R | -- | Security Title Agency |
Source: Public Records
Mortgage History
| Date | Status | Borrower | Loan Amount |
|---|---|---|---|
| Previous Owner | Brown Howard R | $104,706 | |
| Previous Owner | Offerman Geneva R | $60,000 |
Source: Public Records
Tax History Compared to Growth
Tax History
| Year | Tax Paid | Tax Assessment Tax Assessment Total Assessment is a certain percentage of the fair market value that is determined by local assessors to be the total taxable value of land and additions on the property. | Land | Improvement |
|---|---|---|---|---|
| 2025 | $1,241 | $15,496 | -- | -- |
| 2024 | $1,120 | $14,758 | -- | -- |
| 2023 | $1,120 | $26,160 | $5,230 | $20,930 |
| 2022 | $1,050 | $21,200 | $4,240 | $16,960 |
| 2021 | $1,084 | $19,420 | $3,880 | $15,540 |
| 2020 | $1,055 | $16,580 | $3,310 | $13,270 |
| 2019 | $1,038 | $14,370 | $2,870 | $11,500 |
| 2018 | $1,001 | $12,860 | $2,570 | $10,290 |
| 2017 | $964 | $12,120 | $2,420 | $9,700 |
| 2016 | $903 | $11,270 | $2,250 | $9,020 |
| 2015 | $865 | $11,480 | $2,290 | $9,190 |
Source: Public Records
Map
Nearby Homes
- 18842 N Lakeforest Dr
- 19033 N Signal Butte Cir
- 19045 N Signal Butte Cir Unit 50
- 10414 W Ponderosa Cir
- 18835 N Mayan Dr
- 18822 N Palo Verde Dr
- 10514 Willowcreek Cir
- 20002 N Signal Butte Cir
- 10609 W Concho Cir
- 19222 N Palo Verde Dr
- 9730 W Longhorn Ct
- 10125 Willowcreek Cir
- 19120 N 98th Ln Unit 112
- 19040 N 98th Ln Unit 1
- 19617 N Willowcreek Cir
- 18417 N 99th Dr
- 18442 N 104th Ave
- 9856 W Rimrock Dr
- 9839 W Utopia Rd
- 10318 W Manzanita Dr
- 1191 W 12th Ave -Just Reduced Ave
- 1109 W 12th Ave - Great Views Ave
- 19045 N Lake Forest Dr
- 19037 N Lake Forest Dr
- 19049 N Lake Forest Dr
- 19202 N Lake Forest Dr
- 19046 N Lake Forest Dr
- 19213 N Lake Forest Dr
- 19042 N Lake Forest Dr
- 19206 N Lakeforest Dr
- 19206 N Lake Forest Dr Unit 50
- 19213 N Lakeforest Dr
- 19209 N Lake Forest Dr
- 19053 N Lake Forest Dr
- 19038 N Lake Forest Dr Unit 50
- 19210 N Lake Forest Dr
- 19205 N Lake Forest Dr
- 19034 N Lake Forest Dr
- 19201 N Lake Forest Dr
- 19214 N Lakeforest Dr