1905 Washington Ave SE Cedar Rapids, IA 52403
Bever Park NeighborhoodEstimated Value: $119,000 - $152,000
3
Beds
1
Bath
1,544
Sq Ft
$91/Sq Ft
Est. Value
About This Home
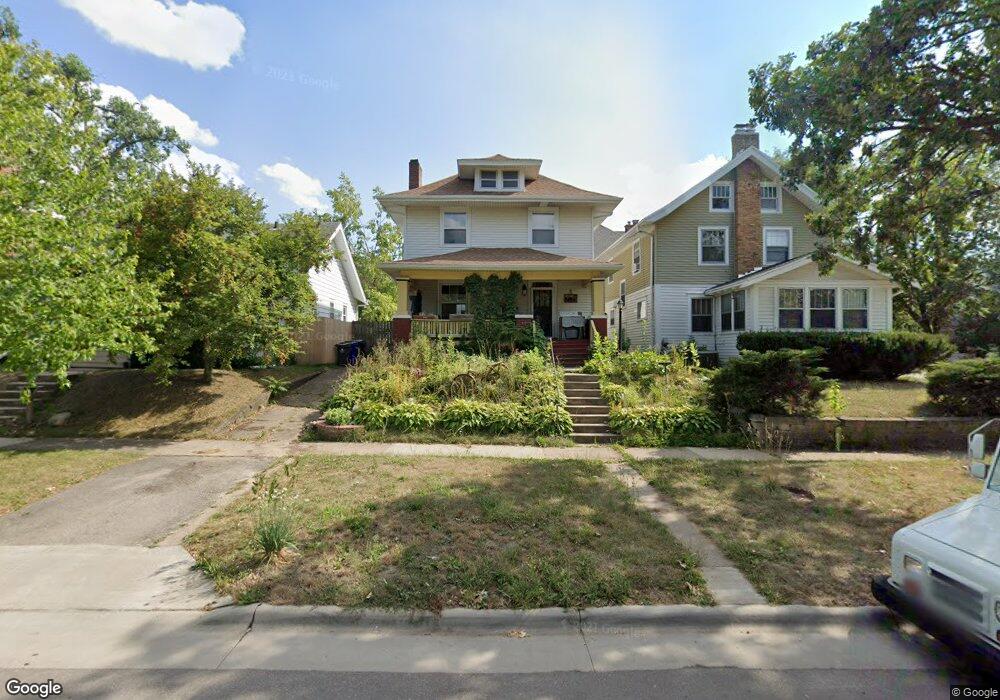
This home is located at 1905 Washington Ave SE, Cedar Rapids, IA 52403 and is currently estimated at $139,910, approximately $90 per square foot. 1905 Washington Ave SE is a home located in Linn County with nearby schools including Johnson STEAM Academy, McKinley STEAM Academy, and George Washington High School.
Ownership History
Date
Name
Owned For
Owner Type
Purchase Details
Closed on
May 22, 2015
Sold by
Scheurer James R
Bought by
Forster Wes A and Forster Jamie L
Current Estimated Value
Purchase Details
Closed on
May 18, 2006
Sold by
First National Acceptance Co
Bought by
Knight Dennis B and Knight Diana L
Home Financials for this Owner
Home Financials are based on the most recent Mortgage that was taken out on this home.
Original Mortgage
$55,920
Interest Rate
6.56%
Mortgage Type
Fannie Mae Freddie Mac
Purchase Details
Closed on
May 8, 2006
Sold by
Knight Dennis B and Knight Diana L
Bought by
Scheurer James R
Home Financials for this Owner
Home Financials are based on the most recent Mortgage that was taken out on this home.
Original Mortgage
$55,920
Interest Rate
6.56%
Mortgage Type
Fannie Mae Freddie Mac
Purchase Details
Closed on
May 28, 2002
Sold by
Lessly Roger E and Lessly Betty J
Bought by
First National Acceptance Company
Create a Home Valuation Report for This Property
The Home Valuation Report is an in-depth analysis detailing your home's value as well as a comparison with similar homes in the area
Home Values in the Area
Average Home Value in this Area
Purchase History
| Date | Buyer | Sale Price | Title Company |
|---|---|---|---|
| Forster Wes A | -- | None Available | |
| Knight Dennis B | $39,838 | None Available | |
| Scheurer James R | $69,500 | None Available | |
| First National Acceptance Company | -- | -- |
Source: Public Records
Mortgage History
| Date | Status | Borrower | Loan Amount |
|---|---|---|---|
| Previous Owner | Scheurer James R | $55,920 |
Source: Public Records
Tax History Compared to Growth
Tax History
| Year | Tax Paid | Tax Assessment Tax Assessment Total Assessment is a certain percentage of the fair market value that is determined by local assessors to be the total taxable value of land and additions on the property. | Land | Improvement |
|---|---|---|---|---|
| 2025 | $1,960 | $126,800 | $25,900 | $100,900 |
| 2024 | $88 | $114,100 | $23,800 | $90,300 |
| 2023 | $88 | $110,700 | $22,400 | $88,300 |
| 2022 | $93 | $108,900 | $22,400 | $86,500 |
| 2021 | $2,094 | $100,900 | $19,600 | $81,300 |
| 2020 | $103 | $94,900 | $16,800 | $78,100 |
| 2019 | $2,080 | $91,500 | $16,800 | $74,700 |
| 2018 | $2,037 | $91,500 | $16,800 | $74,700 |
| 2017 | $1,966 | $90,300 | $16,800 | $73,500 |
| 2016 | $1,724 | $81,100 | $16,800 | $64,300 |
| 2015 | $1,976 | $92,893 | $16,800 | $76,093 |
| 2014 | $2,035 | $104,372 | $14,000 | $90,372 |
| 2013 | -- | $104,372 | $14,000 | $90,372 |
Source: Public Records
Map
Nearby Homes
- 371 20th St SE
- 1949 Park Ave SE
- 361 19th St SE
- 1815 Washington Ave SE
- 1816 Park Ave SE
- 414 18th St SE
- 1741 4th Ave SE
- 1815 5th Ave SE
- 1730 Park Ave SE
- 2020 Grande Ave SE
- 1830 Grande Ave SE
- 1727 Grande Ave SE
- 1801 Blake Blvd SE
- 330 Crescent St SE
- 421 17th St SE
- 2144 Grande Ave SE
- 510 Knollwood Dr SE
- 513 17th St SE
- 1711 Blake Blvd SE
- 520 22nd St SE
- 366 19th St SE
- 1911 Washington Ave SE
- 368 19th St SE
- 1915 Washington Ave SE
- 370 19th St SE
- 1921 Washington Ave SE
- 372 19th St SE
- 1923 Washington Ave SE
- 1906 Washington Ave SE
- 1900 Washington Ave SE
- 374 19th St SE
- 369 19th St SE
- 1908 Washington Ave SE
- 1837 Washington Ave SE
- 371 19th St SE
- 1912 Bever Ave SE
- 1910 Washington Ave SE
- 1927 Washington Ave SE
- 1914 Bever Ave SE
- 1842 Washington Ave SE