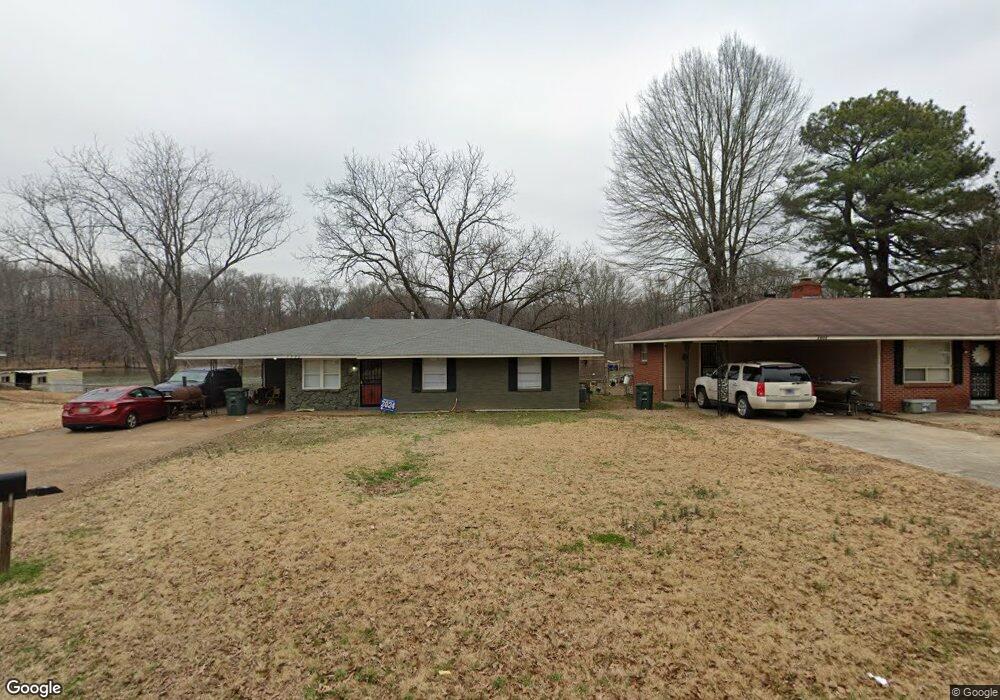
1906 Andover Cove Memphis, TN 38109
Westwood NeighborhoodEstimated Value: $145,000 - $170,340
3
Beds
2
Baths
1,596
Sq Ft
$99/Sq Ft
Est. Value
About This Home
This home is located at 1906 Andover Cove, Memphis, TN 38109 and is currently estimated at $157,835, approximately $98 per square foot. 1906 Andover Cove is a home located in Shelby County with nearby schools including Double Tree Elementary School, Chickasaw Middle School, and Westwood High School.
Ownership History
Date
Name
Owned For
Owner Type
Purchase Details
Closed on
Jan 18, 2019
Sold by
Mid South Homebuyers Gp
Bought by
Flanigan Mark
Current Estimated Value
Home Financials for this Owner
Home Financials are based on the most recent Mortgage that was taken out on this home.
Original Mortgage
$64,800
Outstanding Balance
$56,972
Interest Rate
4.6%
Mortgage Type
New Conventional
Estimated Equity
$100,863
Purchase Details
Closed on
Oct 19, 2018
Sold by
Beach River Capital Llc
Bought by
Mid South Homebuyers Gp
Purchase Details
Closed on
Aug 23, 2018
Sold by
I2l Llc
Bought by
Beach River Caspital Llc
Purchase Details
Closed on
Aug 14, 2018
Sold by
Mcfarland Vince L and Mcfarland Marilyn
Bought by
I2l Llc
Purchase Details
Closed on
Aug 23, 2017
Sold by
Mcfarland Marilyn Simon
Bought by
Mcfarland Vince Lavoy
Create a Home Valuation Report for This Property
The Home Valuation Report is an in-depth analysis detailing your home's value as well as a comparison with similar homes in the area
Home Values in the Area
Average Home Value in this Area
Purchase History
| Date | Buyer | Sale Price | Title Company |
|---|---|---|---|
| Flanigan Mark | $87,000 | Saddle Creek Title Llc | |
| Mid South Homebuyers Gp | $34,000 | Saddle Creek Title Llc | |
| Beach River Caspital Llc | -- | None Available | |
| I2l Llc | $25,100 | None Available | |
| Mcfarland Vince Lavoy | -- | None Available |
Source: Public Records
Mortgage History
| Date | Status | Borrower | Loan Amount |
|---|---|---|---|
| Open | Flanigan Mark | $64,800 |
Source: Public Records
Tax History Compared to Growth
Tax History
| Year | Tax Paid | Tax Assessment Tax Assessment Total Assessment is a certain percentage of the fair market value that is determined by local assessors to be the total taxable value of land and additions on the property. | Land | Improvement |
|---|---|---|---|---|
| 2025 | $769 | $39,000 | $4,100 | $34,900 |
| 2024 | $769 | $22,675 | $2,975 | $19,700 |
| 2023 | $1,381 | $22,675 | $2,975 | $19,700 |
| 2022 | $1,381 | $22,675 | $2,975 | $19,700 |
| 2021 | $1,397 | $22,675 | $2,975 | $19,700 |
| 2020 | $1,263 | $17,425 | $2,975 | $14,450 |
| 2019 | $557 | $17,425 | $2,975 | $14,450 |
| 2018 | $557 | $17,425 | $2,975 | $14,450 |
| 2017 | $570 | $17,425 | $2,975 | $14,450 |
| 2016 | $752 | $17,200 | $0 | $0 |
| 2014 | $752 | $17,200 | $0 | $0 |
Source: Public Records
Map
Nearby Homes
- 1820 W Holmes Rd
- 1740 W Dodd Rd
- 5095 Bowie Rd
- 5190 Aureen Dr
- 4830 Coro Rd
- 5102 E Shore Dr
- 4996 E Shore Dr
- 1362 Blackiston Cove
- 1370 W North Dr
- 4886 Bilco Ave
- 1390 North Dr
- 5299 Airview Rd
- 0 Cessna Rd
- 1230 Longcrest Rd
- 1258 Deer Trail Ln
- 4509 Double Tree Rd
- 5137 Tully Rd
- 1245 W Shelby Dr
- 4487 Weaver Rd S
- 8905 Oak Ridge Dr
- 1900 Andover Cove
- 1910 Andover Cove
- 1892 Andover Cove
- 1914 Andover Cove
- 1886 Andover Cove
- 1905 Andover Cove
- 1897 Andover Cove
- 1909 Andover Cove
- 1889 Andover Cove
- 1880 Andover Cove
- 1881 Andover Cove
- 1910 Nantucket Dr
- 1902 Nantucket Dr
- 1874 Andover Cove
- 1916 Nantucket Dr
- 1896 Nantucket Dr
- 5081 Andover Dr
- 1875 Andover Cove
- 1924 Nantucket Dr
- 1890 Nantucket Dr