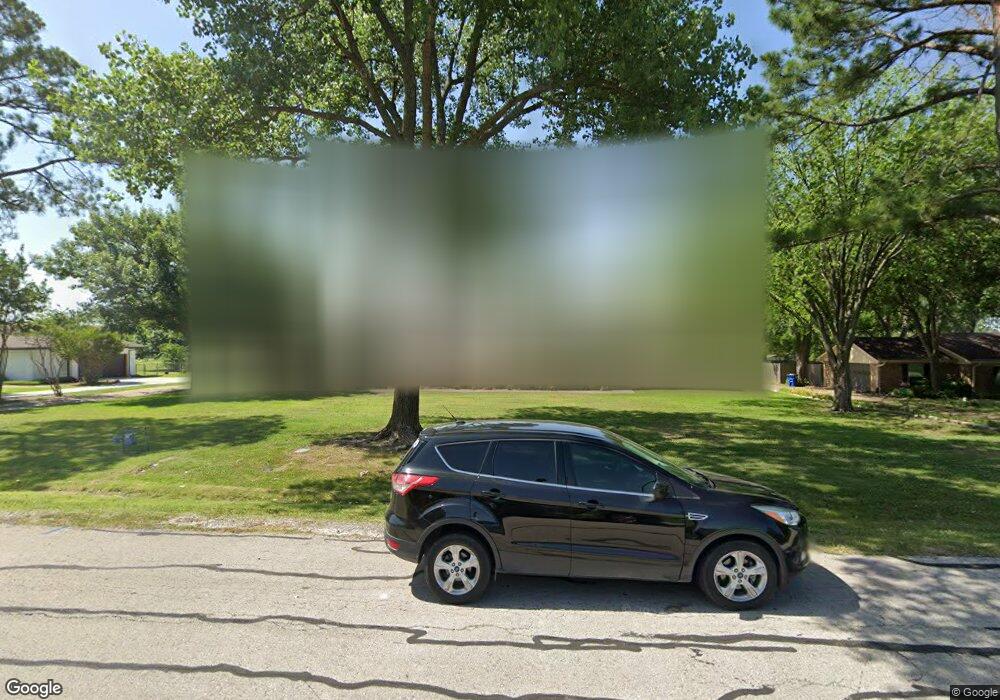
1906 Cartwright Dr Sachse, TX 75048
Estimated Value: $658,829 - $725,000
4
Beds
2
Baths
3,448
Sq Ft
$202/Sq Ft
Est. Value
About This Home
This home is located at 1906 Cartwright Dr, Sachse, TX 75048 and is currently estimated at $695,207, approximately $201 per square foot. 1906 Cartwright Dr is a home located in Dallas County with nearby schools including Firewheel Christian Academy and Pinnacle Montessori of Sachse.
Ownership History
Date
Name
Owned For
Owner Type
Purchase Details
Closed on
Jan 19, 2024
Sold by
Bishop Marissa
Bought by
Marissa Marra Bishop Revocable Living Trust and Bishop
Current Estimated Value
Purchase Details
Closed on
Jul 22, 2008
Sold by
Bishop David Scott
Bought by
Bishop Marissa
Purchase Details
Closed on
Nov 17, 2005
Sold by
Payne Fred Zeb and Payne Kimberlee
Bought by
Bishop David Scott and Bishop Marissa Marra
Home Financials for this Owner
Home Financials are based on the most recent Mortgage that was taken out on this home.
Original Mortgage
$222,300
Interest Rate
6.04%
Mortgage Type
Fannie Mae Freddie Mac
Purchase Details
Closed on
Dec 20, 1993
Sold by
Payne Fred Zeb and Payne Ona M
Bought by
Payne Fred Zeb and Payne Kimberlee
Home Financials for this Owner
Home Financials are based on the most recent Mortgage that was taken out on this home.
Original Mortgage
$80,000
Interest Rate
7.16%
Mortgage Type
Seller Take Back
Create a Home Valuation Report for This Property
The Home Valuation Report is an in-depth analysis detailing your home's value as well as a comparison with similar homes in the area
Home Values in the Area
Average Home Value in this Area
Purchase History
| Date | Buyer | Sale Price | Title Company |
|---|---|---|---|
| Marissa Marra Bishop Revocable Living Trust | -- | None Listed On Document | |
| Bishop Marissa | -- | None Available | |
| Bishop David Scott | -- | Rtt | |
| Payne Fred Zeb | -- | -- |
Source: Public Records
Mortgage History
| Date | Status | Borrower | Loan Amount |
|---|---|---|---|
| Previous Owner | Bishop David Scott | $222,300 | |
| Previous Owner | Payne Fred Zeb | $80,000 | |
| Closed | Bishop Marissa | $0 |
Source: Public Records
Tax History
| Year | Tax Paid | Tax Assessment Tax Assessment Total Assessment is a certain percentage of the fair market value that is determined by local assessors to be the total taxable value of land and additions on the property. | Land | Improvement |
|---|---|---|---|---|
| 2025 | $9,289 | $750,000 | $100,000 | $650,000 |
| 2024 | $9,289 | $587,290 | $100,000 | $487,290 |
| 2023 | $9,289 | $508,000 | $100,000 | $408,000 |
| 2022 | $12,154 | $508,000 | $100,000 | $408,000 |
| 2021 | $9,396 | $365,090 | $100,000 | $265,090 |
| 2020 | $9,551 | $365,090 | $100,000 | $265,090 |
| 2019 | $10,356 | $365,090 | $100,000 | $265,090 |
| 2018 | $9,430 | $329,270 | $100,000 | $229,270 |
| 2017 | $8,484 | $295,390 | $50,000 | $245,390 |
| 2016 | $6,189 | $215,490 | $50,000 | $165,490 |
| 2015 | $4,087 | $167,300 | $40,000 | $127,300 |
| 2014 | $4,087 | $167,300 | $40,000 | $127,300 |
Source: Public Records
Map
Nearby Homes
- 2321 3rd St
- 2011 Cori Place
- 2405 3rd St
- 6805 Foxglove Trail
- 1407 Ponderosa Dr
- 2104 Ponderosa Trail
- 2612 Herring Cir
- 2620 Mcdearmon St
- 7022 Cottonwood Cir
- 7006 Burning Bush
- 6408 Hilltop Trail
- 2209 Vicksburg Dr
- 333 Green Acres Dr
- 5703 Pecan Grove Dr
- 7307 Crane Dr
- 1226 Donegal Ln
- 7319 Crane Dr
- 3103 Scott Dr
- 3109 Scott Dr
- 3207 Tina St
- 2002 Cartwright Dr
- 1904 Cartwright Dr
- 1907 Bonanza Dr
- 2004 Cartwright Dr
- 2005 Bonanza Dr
- 1802 Cartwright Dr
- 1901 Bonanza Dr
- 1905 Cartwright Dr
- 2001 Cartwright Dr
- 1907 Cartwright Dr
- 2104 Cartwright Dr
- 1800 Cartwright Dr
- 1803 Cartwright Dr
- 2003 Cartwright Dr
- 2101 Bonanza Dr
- 1803 Bonanza Dr
- 2105 Cartwright Dr
- 1801 Cartwright Dr
- 2108 Cartwright Dr
- 1708 Cartwright Dr
Your Personal Tour Guide
Ask me questions while you tour the home.