Estimated Value: $241,140 - $253,000
3
Beds
2
Baths
1,430
Sq Ft
$174/Sq Ft
Est. Value
About This Home
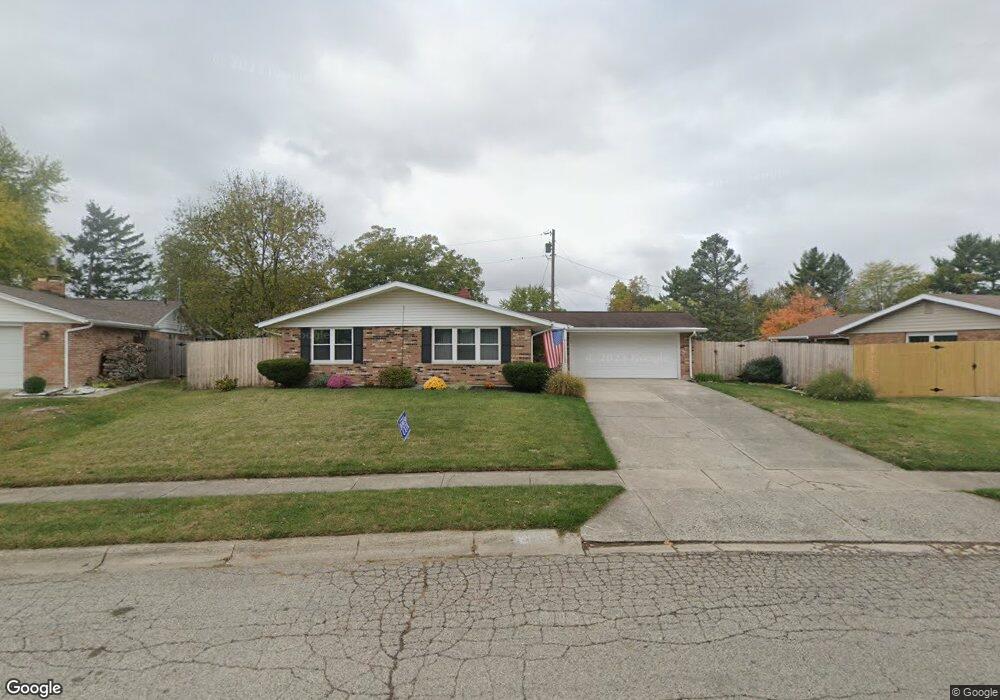
This home is located at 1906 Delta Ave, Xenia, OH 45385 and is currently estimated at $248,285, approximately $173 per square foot. 1906 Delta Ave is a home located in Greene County with nearby schools including Xenia High School, Summit Academy Community School for Alternative Learners - Xenia, and Legacy Christian Academy.
Ownership History
Date
Name
Owned For
Owner Type
Purchase Details
Closed on
May 14, 1999
Sold by
Obryant Larry E and Obryant Rebecca Turner
Bought by
Obryant Larry E and Bryant Rebecca Turner
Current Estimated Value
Home Financials for this Owner
Home Financials are based on the most recent Mortgage that was taken out on this home.
Original Mortgage
$84,000
Outstanding Balance
$21,501
Interest Rate
7.17%
Estimated Equity
$226,784
Purchase Details
Closed on
Apr 19, 1999
Sold by
Wills Christopher L and Wills Tina M
Bought by
Obryant Larry E and Turner Obryant Rebecca
Home Financials for this Owner
Home Financials are based on the most recent Mortgage that was taken out on this home.
Original Mortgage
$84,000
Outstanding Balance
$21,501
Interest Rate
7.17%
Estimated Equity
$226,784
Purchase Details
Closed on
Sep 21, 1998
Sold by
Powers Waldron Pauline and Waldron Nancy Pauline
Bought by
Wills Christopher L and Wills Tina M
Create a Home Valuation Report for This Property
The Home Valuation Report is an in-depth analysis detailing your home's value as well as a comparison with similar homes in the area
Home Values in the Area
Average Home Value in this Area
Purchase History
| Date | Buyer | Sale Price | Title Company |
|---|---|---|---|
| Obryant Larry E | -- | -- | |
| Obryant Larry E | $110,000 | Home Site Title Agency Inc | |
| Wills Christopher L | $79,000 | -- |
Source: Public Records
Mortgage History
| Date | Status | Borrower | Loan Amount |
|---|---|---|---|
| Open | Obryant Larry E | $84,000 |
Source: Public Records
Tax History Compared to Growth
Tax History
| Year | Tax Paid | Tax Assessment Tax Assessment Total Assessment is a certain percentage of the fair market value that is determined by local assessors to be the total taxable value of land and additions on the property. | Land | Improvement |
|---|---|---|---|---|
| 2024 | $2,178 | $62,040 | $10,690 | $51,350 |
| 2023 | $2,178 | $62,040 | $10,690 | $51,350 |
| 2022 | $1,886 | $47,310 | $6,290 | $41,020 |
| 2021 | $1,911 | $47,310 | $6,290 | $41,020 |
| 2020 | $1,829 | $47,310 | $6,290 | $41,020 |
| 2019 | $1,373 | $35,990 | $6,340 | $29,650 |
| 2018 | $1,378 | $35,990 | $6,340 | $29,650 |
| 2017 | $1,338 | $35,990 | $6,340 | $29,650 |
| 2016 | $1,300 | $33,970 | $6,340 | $27,630 |
| 2015 | $1,303 | $33,970 | $6,340 | $27,630 |
| 2014 | $1,247 | $33,970 | $6,340 | $27,630 |
Source: Public Records
Map
Nearby Homes
- 2018 Tahoe Dr
- 2094 Malibu Trail
- 1872 Harris Ln
- 1815 Promenade Ln
- 493 Hollywood Blvd
- 499 Hollywood Blvd
- 15 Sexton Dr
- 1791 Palmer Ct
- 1820 Palmer Ct
- 1814 Palmer Ct
- 1808 Palmer Ct
- 1802 Palmer Ct
- 1796 Palmer Ct
- 517 Hollywood Blvd
- 523 Hollywood Blvd
- 532 Hollywood Blvd
- Harmony Plan at Grandstone Trace
- Newcastle Plan at Grandstone Trace
- Pendleton Plan at Grandstone Trace
- Bellamy Plan at Grandstone Trace