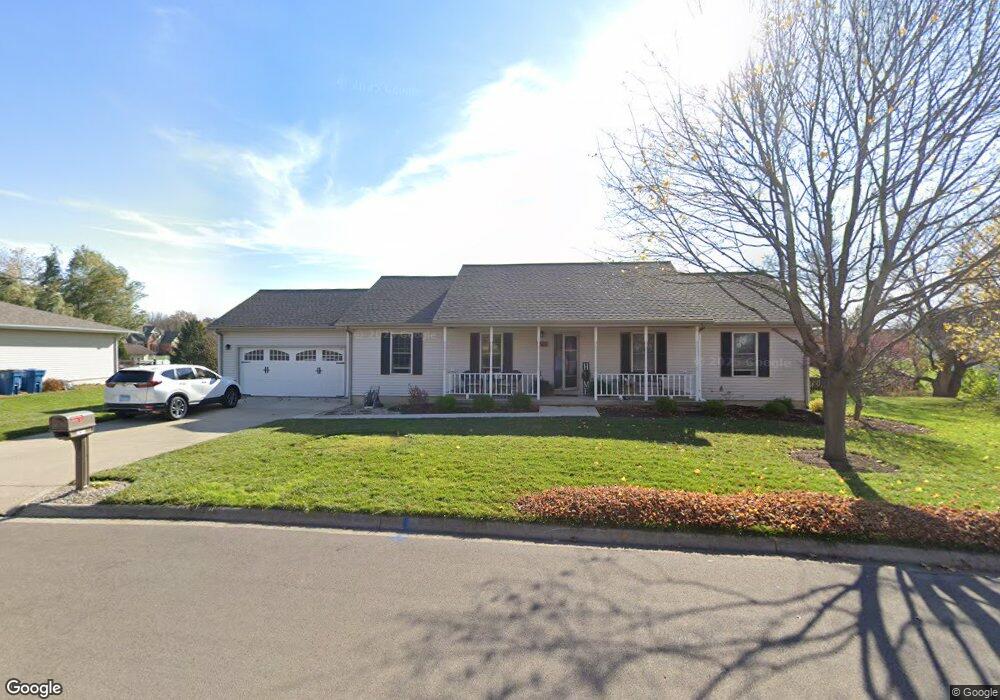
1906 Diana Dr Mendota, IL 61342
Estimated Value: $206,753 - $264,000
--
Bed
--
Bath
1,620
Sq Ft
$150/Sq Ft
Est. Value
About This Home
This home is located at 1906 Diana Dr, Mendota, IL 61342 and is currently estimated at $242,688, approximately $149 per square foot. 1906 Diana Dr is a home located in LaSalle County with nearby schools including Northbrook School, Lincoln Elementary School, and Blackstone Elementary School.
Ownership History
Date
Name
Owned For
Owner Type
Purchase Details
Closed on
Nov 10, 2023
Sold by
Marshall Kimberly L
Bought by
Marshall James R and Kimberly L Marshall Revocable Living Tru
Current Estimated Value
Purchase Details
Closed on
Nov 10, 2014
Sold by
Marshall James R
Bought by
Marshall James R and Marshall Kimberly L
Purchase Details
Closed on
Aug 15, 2013
Sold by
Steele Dena L and Pakenham Dena L
Bought by
Marshall James R
Home Financials for this Owner
Home Financials are based on the most recent Mortgage that was taken out on this home.
Original Mortgage
$124,200
Interest Rate
4.5%
Mortgage Type
New Conventional
Purchase Details
Closed on
Jun 1, 2012
Sold by
Pakenham Daniel J
Bought by
Steele Dena L and Pakenham Dena L
Home Financials for this Owner
Home Financials are based on the most recent Mortgage that was taken out on this home.
Original Mortgage
$123,000
Interest Rate
4.5%
Mortgage Type
Assumption
Create a Home Valuation Report for This Property
The Home Valuation Report is an in-depth analysis detailing your home's value as well as a comparison with similar homes in the area
Home Values in the Area
Average Home Value in this Area
Purchase History
| Date | Buyer | Sale Price | Title Company |
|---|---|---|---|
| Marshall James R | -- | None Available | |
| Marshall James R | -- | -- | |
| Marshall James R | $138,000 | None Available | |
| Steele Dena L | -- | None Available |
Source: Public Records
Mortgage History
| Date | Status | Borrower | Loan Amount |
|---|---|---|---|
| Previous Owner | Marshall James R | $124,200 | |
| Previous Owner | Steele Dena L | $123,000 |
Source: Public Records
Tax History Compared to Growth
Tax History
| Year | Tax Paid | Tax Assessment Tax Assessment Total Assessment is a certain percentage of the fair market value that is determined by local assessors to be the total taxable value of land and additions on the property. | Land | Improvement |
|---|---|---|---|---|
| 2024 | $4,558 | $58,619 | $6,893 | $51,726 |
| 2023 | $4,330 | $54,590 | $6,419 | $48,171 |
| 2022 | $3,915 | $49,768 | $5,852 | $43,916 |
| 2021 | $3,867 | $47,111 | $5,540 | $41,571 |
| 2020 | $3,606 | $44,482 | $5,231 | $39,251 |
| 2019 | $3,657 | $44,482 | $5,231 | $39,251 |
| 2018 | $3,982 | $46,386 | $5,116 | $41,270 |
| 2017 | $4,027 | $45,799 | $5,051 | $40,748 |
| 2016 | $3,864 | $43,848 | $4,836 | $39,012 |
| 2015 | $3,746 | $42,517 | $4,689 | $37,828 |
| 2012 | -- | $48,698 | $5,371 | $43,327 |
Source: Public Records
Map
Nearby Homes