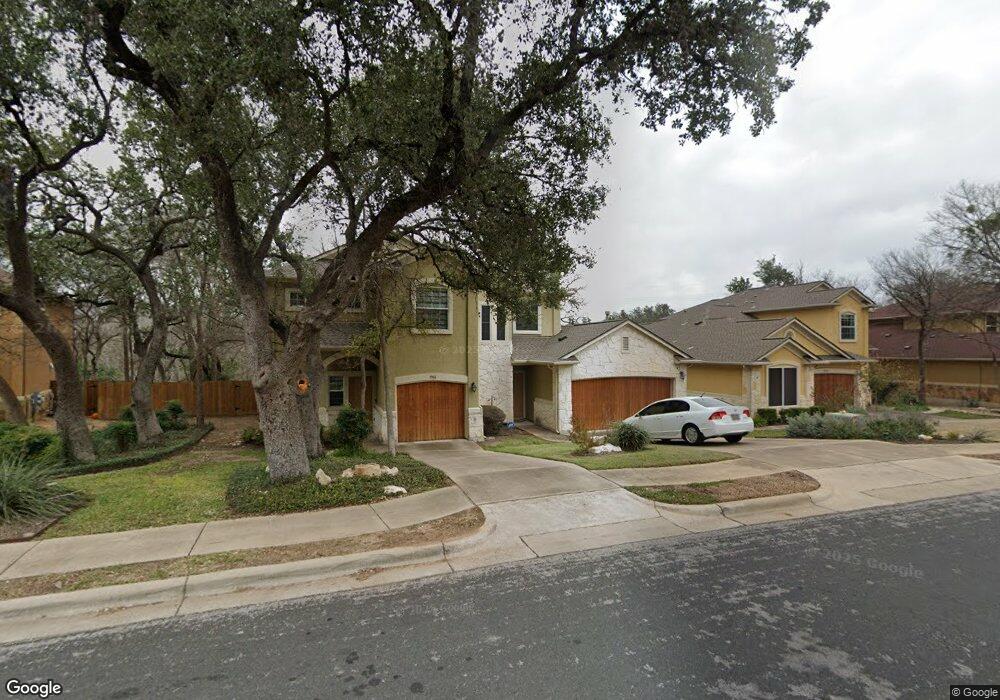
1906 Jentsch Ct Unit 2B Austin, TX 78745
South Manchaca NeighborhoodEstimated Value: $468,000 - $533,000
3
Beds
3
Baths
1,763
Sq Ft
$290/Sq Ft
Est. Value
About This Home
This home is located at 1906 Jentsch Ct Unit 2B, Austin, TX 78745 and is currently estimated at $511,166, approximately $289 per square foot. 1906 Jentsch Ct Unit 2B is a home located in Travis County with nearby schools including Sunset Valley Elementary School, Covington Middle School, and Crockett High School.
Ownership History
Date
Name
Owned For
Owner Type
Purchase Details
Closed on
Apr 21, 2020
Sold by
Boswell J T
Bought by
Pinsonneault Matt and Pinsonneault Susan
Current Estimated Value
Home Financials for this Owner
Home Financials are based on the most recent Mortgage that was taken out on this home.
Original Mortgage
$337,500
Outstanding Balance
$298,416
Interest Rate
3.3%
Mortgage Type
New Conventional
Estimated Equity
$212,750
Purchase Details
Closed on
Jan 4, 2018
Sold by
Kriese Richard
Bought by
Boswell J T
Purchase Details
Closed on
May 18, 2012
Sold by
Turner Brandy L
Bought by
Kriese Richard
Purchase Details
Closed on
Sep 17, 2004
Sold by
Spicewood Residential Ltd
Bought by
Turner Brandy L
Home Financials for this Owner
Home Financials are based on the most recent Mortgage that was taken out on this home.
Original Mortgage
$159,600
Interest Rate
5.95%
Mortgage Type
Purchase Money Mortgage
Create a Home Valuation Report for This Property
The Home Valuation Report is an in-depth analysis detailing your home's value as well as a comparison with similar homes in the area
Home Values in the Area
Average Home Value in this Area
Purchase History
| Date | Buyer | Sale Price | Title Company |
|---|---|---|---|
| Pinsonneault Matt | -- | None Available | |
| Boswell J T | -- | Capital Title | |
| Kriese Richard | -- | None Available | |
| Turner Brandy L | -- | Commonwealth Land Title |
Source: Public Records
Mortgage History
| Date | Status | Borrower | Loan Amount |
|---|---|---|---|
| Open | Pinsonneault Matt | $337,500 | |
| Previous Owner | Turner Brandy L | $159,600 | |
| Closed | Turner Brandy L | $15,000 |
Source: Public Records
Tax History Compared to Growth
Tax History
| Year | Tax Paid | Tax Assessment Tax Assessment Total Assessment is a certain percentage of the fair market value that is determined by local assessors to be the total taxable value of land and additions on the property. | Land | Improvement |
|---|---|---|---|---|
| 2025 | $4,011 | $387,412 | $124,364 | $263,048 |
| 2023 | $3,714 | $453,750 | $0 | $0 |
| 2022 | $5,172 | $412,500 | $0 | $0 |
| 2021 | $8,350 | $375,000 | $124,364 | $250,636 |
| 2020 | $7,576 | $353,216 | $93,273 | $259,943 |
| 2018 | $7,535 | $340,327 | $93,273 | $247,054 |
| 2017 | $6,632 | $299,530 | $55,000 | $244,530 |
| 2016 | $7,214 | $323,462 | $55,000 | $268,462 |
| 2015 | $6,775 | $312,401 | $55,000 | $257,401 |
| 2014 | $6,775 | $284,671 | $55,000 | $229,671 |
Source: Public Records
Map
Nearby Homes
- 5107 Menchaca Rd Unit 9
- The Barton Plan at Grove Place
- The Travis Plan at Grove Place
- The Ladybird Plan at Grove Place
- 5107 Menchaca Rd Unit 10
- The Shoal Plan at Grove Place
- 5107 Menchaca Rd Unit 11
- 1708 Fair Oaks Dr
- 4803 Philco Dr
- 5007 Buckskin Pass
- 2002 Southern Oaks Dr Unit 1
- 4819 Roundup Trail
- 5008 Buckskin Pass
- 5008 Glencoe Cir
- 4704 Philco Dr
- 5201 Periwinkle Path
- 2203 Southern Oaks Dr
- 2305 Laramie Trail
- 4802 Gladeview Dr Unit 2
- 4701 Sylvandale Dr Unit 1
- 1906 Jentsch Ct Unit B
- 1906 Jentsch Ct Unit 2A
- 1906 Jentsch Ct Unit A
- 1904 Jentsch Ct Unit 3B
- 1904 Jentsch Ct Unit 3A
- 1904 Jentsch Ct Unit B
- 1904 Jentsch Ct Unit A
- 1908 Jentsch Ct Unit 1B
- 1908 Jentsch Ct Unit 1A
- 1908 Jentsch Ct Unit A
- 1908 Jentsch Ct
- 1908 Jentsch Ct Unit B
- 1905 Jentsch Ct Unit 20B
- 1905 Jentsch Ct Unit 20A
- 1905 Jentsch Ct Unit B
- 1905 Jentsch Ct Unit A
- 1902 Jentsch Ct Unit A
- 1902 Jentsch Ct Unit 4B
- 1902 Jentsch Ct Unit 4A
- 1902 Jentsch Ct Unit B