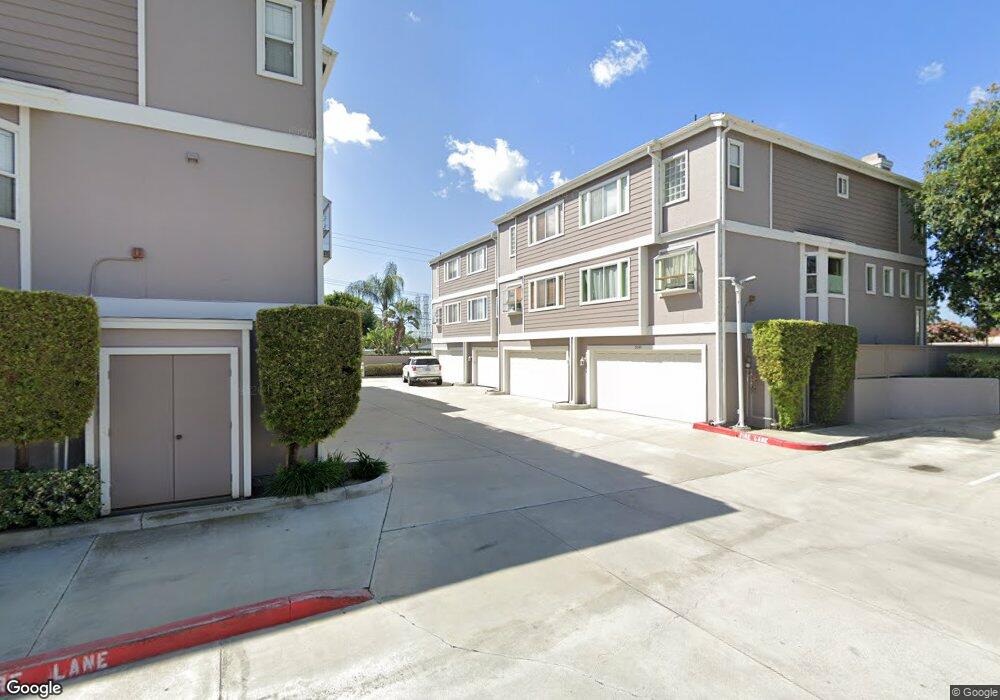
19061 Windridge Ln Huntington Beach, CA 92646
Estimated Value: $896,000 - $1,106,383
2
Beds
3
Baths
1,558
Sq Ft
$647/Sq Ft
Est. Value
About This Home
This home is located at 19061 Windridge Ln, Huntington Beach, CA 92646 and is currently estimated at $1,007,596, approximately $646 per square foot. 19061 Windridge Ln is a home located in Orange County with nearby schools including Isojiro Oka Elementary, Talbert Middle School, and Huntington Beach High School.
Ownership History
Date
Name
Owned For
Owner Type
Purchase Details
Closed on
Mar 28, 2018
Sold by
Ninh Wendi Kim and Ninh Kim Nguyen
Bought by
Ninh Wendi Kim and Hte Wendi Kim Ninh 2018 Revocable Trust
Current Estimated Value
Purchase Details
Closed on
Nov 13, 2017
Sold by
Ninh Kim Nguyen
Bought by
Nihn Wendi Kim and Nihn Kim Nguyen
Purchase Details
Closed on
Apr 5, 2001
Sold by
Ninh Kim Nguyen
Bought by
Ninh Kim Nguyen and The Kimmy Ninh Revocable Trust
Purchase Details
Closed on
Mar 26, 2001
Sold by
Ninh Cam and Ninh Kim Nguyen
Bought by
Ninh Kim Nguyen
Purchase Details
Closed on
Feb 23, 1994
Sold by
Garfield Crest Ltd
Bought by
Ninh Cam and Ninh Kim Nguyen
Home Financials for this Owner
Home Financials are based on the most recent Mortgage that was taken out on this home.
Original Mortgage
$100,000
Interest Rate
5.25%
Create a Home Valuation Report for This Property
The Home Valuation Report is an in-depth analysis detailing your home's value as well as a comparison with similar homes in the area
Home Values in the Area
Average Home Value in this Area
Purchase History
| Date | Buyer | Sale Price | Title Company |
|---|---|---|---|
| Ninh Wendi Kim | -- | None Available | |
| Nihn Wendi Kim | -- | Accommodation | |
| Ninh Kim Nguyen | -- | -- | |
| Ninh Kim Nguyen | -- | -- | |
| Ninh Cam | $186,000 | Commonwealth Land Title |
Source: Public Records
Mortgage History
| Date | Status | Borrower | Loan Amount |
|---|---|---|---|
| Previous Owner | Ninh Cam | $100,000 |
Source: Public Records
Tax History Compared to Growth
Tax History
| Year | Tax Paid | Tax Assessment Tax Assessment Total Assessment is a certain percentage of the fair market value that is determined by local assessors to be the total taxable value of land and additions on the property. | Land | Improvement |
|---|---|---|---|---|
| 2025 | $3,779 | $316,131 | $104,541 | $211,590 |
| 2024 | $3,779 | $309,933 | $102,491 | $207,442 |
| 2023 | $3,688 | $303,856 | $100,481 | $203,375 |
| 2022 | $3,632 | $297,899 | $98,511 | $199,388 |
| 2021 | $3,563 | $292,058 | $96,579 | $195,479 |
| 2020 | $3,541 | $289,064 | $95,589 | $193,475 |
| 2019 | $3,473 | $283,397 | $93,715 | $189,682 |
| 2018 | $3,952 | $327,366 | $147,287 | $180,079 |
| 2017 | $3,355 | $272,394 | $90,077 | $182,317 |
| 2016 | $3,217 | $267,053 | $88,310 | $178,743 |
| 2015 | $3,168 | $263,042 | $86,983 | $176,059 |
| 2014 | $3,106 | $257,890 | $85,279 | $172,611 |
Source: Public Records
Map
Nearby Homes
- 9462 Litchfield Dr
- 9850 Garfield Ave Unit 129
- 9850 Garfield Ave Unit 18
- 9850 Garfield Ave Unit 91
- 9850 Garfield Ave Unit 35
- 9850 Garfield Ave Unit 5
- 9850 Garfield Ave Unit 130
- 9850 Garfield Ave Unit 33
- 18820 Cordata St
- 19251 Brookhurst St Unit 137
- 19251 Brookhurst St Unit 13
- 19251 Brookhurst St Unit 48
- 19251 Brookhurst St Unit 11
- 19251 Brookhurst St Unit 38
- 19251 Brookhurst St Unit 69
- 19251 Brookhurst St Unit 22
- 19202 Hickory Ln
- 18760 Cordata St
- 9331 Grand Dr
- 19361 Brookhurst St Unit 87
- 19055 Windridge Ln
- 19051 Windridge Ln
- 19045 Windridge Ln
- 9531 Bass Dr
- 9541 Bass Dr
- 19062 Windridge Ln
- 19056 Windridge Ln
- 19052 Windridge Ln
- 19046 Windridge Ln
- 9511 Bass Dr
- 9551 Bass Dr
- 19025 Windridge Ln
- 9501 Bass Dr
- 9572 Albacore Dr
- 19021 Windridge Ln
- 19022 Windridge Ln
- 19015 Windridge Ln
- 19018 Windridge Ln
- 19072 Walleye Ln
- 19011 Windridge Ln