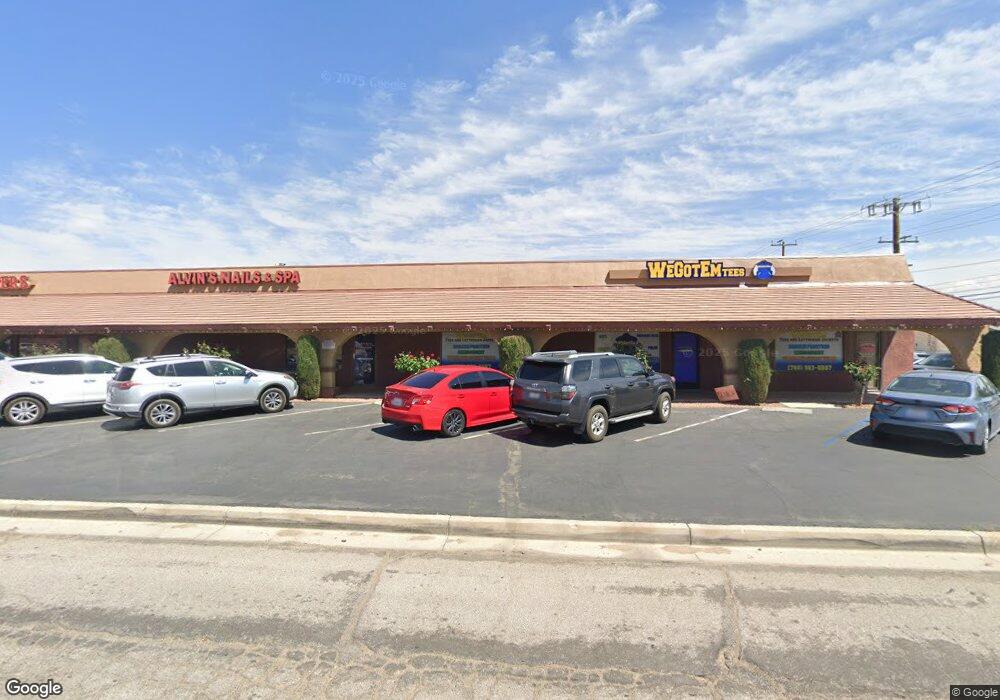
19063 Outer Highway 18 S Apple Valley, CA 92307
High Desert NeighborhoodEstimated Value: $1,223,135
Studio
1
Bath
6,360
Sq Ft
$192/Sq Ft
Est. Value
About This Home
This home is located at 19063 Outer Highway 18 S, Apple Valley, CA 92307 and is currently estimated at $1,223,135, approximately $192 per square foot. 19063 Outer Highway 18 S is a home located in San Bernardino County with nearby schools including Desert Knolls Elementary School, Granite Hills High School, and Academy for Academic Excellence.
Ownership History
Date
Name
Owned For
Owner Type
Purchase Details
Closed on
Feb 26, 2016
Sold by
Eiswert Joseph E and Eiswert Rachel L
Bought by
The 2015 Joseph E Eiswert & Rachel L Eis
Current Estimated Value
Purchase Details
Closed on
Jan 16, 2015
Sold by
Eiswert Joseph E
Bought by
Eiswert 2015 Joseph E Eiswert and Eiswert Rachel L
Purchase Details
Closed on
Mar 5, 2001
Sold by
Brewster Sally L
Bought by
Eiswert Joseph E
Home Financials for this Owner
Home Financials are based on the most recent Mortgage that was taken out on this home.
Original Mortgage
$240,000
Interest Rate
6.97%
Mortgage Type
Seller Take Back
Purchase Details
Closed on
Apr 7, 1994
Sold by
Allen Sally L Brewster
Bought by
Brewster Sally L
Create a Home Valuation Report for This Property
The Home Valuation Report is an in-depth analysis detailing your home's value as well as a comparison with similar homes in the area
Home Values in the Area
Average Home Value in this Area
Purchase History
| Date | Buyer | Sale Price | Title Company |
|---|---|---|---|
| The 2015 Joseph E Eiswert & Rachel L Eis | -- | Accommodation | |
| Eiswert 2015 Joseph E Eiswert | -- | None Available | |
| Eiswert Joseph E | $300,000 | First American Title Ins Co | |
| Eiswert Joseph E | -- | First American Title Ins Co | |
| Brewster Sally L | -- | -- |
Source: Public Records
Mortgage History
| Date | Status | Borrower | Loan Amount |
|---|---|---|---|
| Previous Owner | Eiswert Joseph E | $240,000 |
Source: Public Records
Tax History
| Year | Tax Paid | Tax Assessment Tax Assessment Total Assessment is a certain percentage of the fair market value that is determined by local assessors to be the total taxable value of land and additions on the property. | Land | Improvement |
|---|---|---|---|---|
| 2025 | $6,623 | $549,099 | $152,042 | $397,057 |
| 2024 | $6,437 | $538,333 | $149,061 | $389,272 |
| 2023 | $6,377 | $527,777 | $146,138 | $381,639 |
| 2022 | $6,280 | $517,429 | $143,273 | $374,156 |
| 2021 | $6,137 | $507,284 | $140,464 | $366,820 |
| 2020 | $6,063 | $502,083 | $139,024 | $363,059 |
| 2019 | $5,951 | $492,238 | $136,298 | $355,940 |
| 2018 | $5,805 | $482,586 | $133,625 | $348,961 |
| 2017 | $5,725 | $473,124 | $131,005 | $342,119 |
| 2016 | $5,573 | $463,847 | $128,436 | $335,411 |
| 2015 | $5,490 | $456,880 | $126,507 | $330,373 |
| 2014 | $5,416 | $447,930 | $124,029 | $323,901 |
Source: Public Records
Map
Nearby Homes
- 18924 Symeron Rd
- 15908 Acoma Rd
- 15944 Wintun Rd
- 18730 Chapae Ln
- 16035 Venango Rd
- 16055 Saint Timothy Rd
- 18539 Symeron Rd
- 18965 Siskiyou Rd
- 15650 Pohez Rd
- 15128 Mendota Rd
- 15103 Wilson Ct
- 15617 Mondamon Rd
- 2 Apple Valley Rd
- 15358 Apple Valley Rd
- 19375 Corwin Rd
- 0 15771 Mondamon Rd
- 0 Taloga Ln
- 16257 Saint Timothy Rd
- 15490 Mondamon Rd
- 0 Roanoke Rd Unit HD25142103
- 19063 California 18 Unit 102
- 19063 California 18
- 48 Yanan Rd
- 19031 Us Highway 18 Unit 230
- 19031 Us Highway 18 Unit 220
- 19031 Us Highway 18 Unit 240, 250, 260, 270
- 19031 Us Highway 18
- 19031 Us Highway 18 Unit 270
- 19031 Us Highway 18 Unit 250
- 19031 Us Highway 18 Unit 240
- 19031 Us Highway 18 Unit 140
- 19031 Us Highway 18 Unit 210
- 19031 Us Highway 18 Unit 200
- 19031 California 18 Unit 240
- 19006 Yanan Rd
- 19022 Symeron Rd
- 19028 Yanan (Bonus See Remarks)
- 0 Yanan Rd
- 19028 Yanan Rd
- 19001 California 18 Unit 4
Your Personal Tour Guide
Ask me questions while you tour the home.