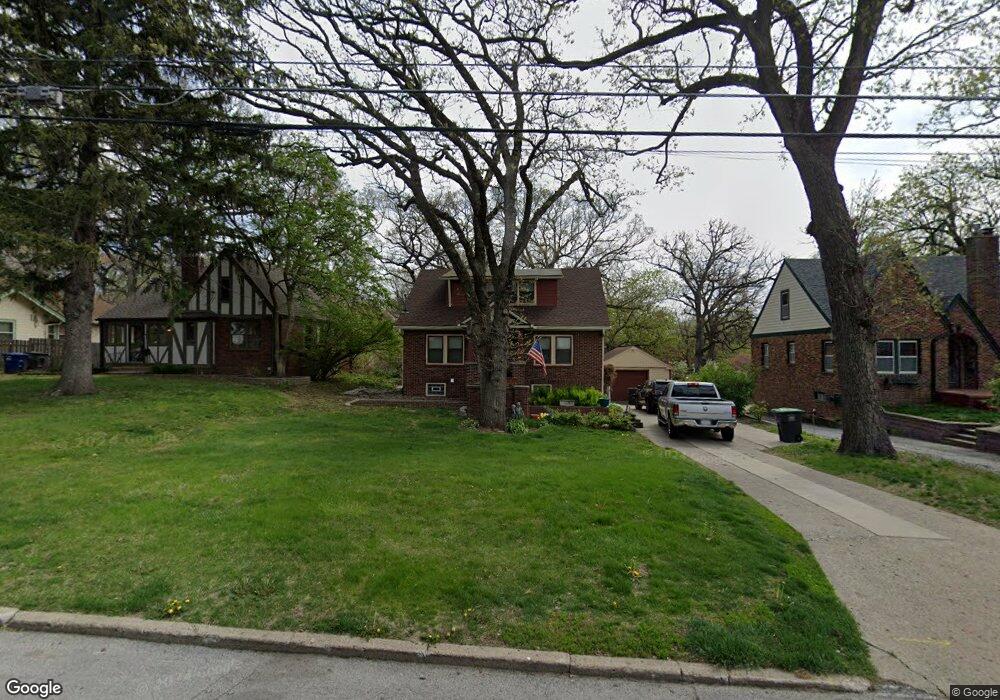
1907 34th St Des Moines, IA 50310
Beaverdale NeighborhoodEstimated Value: $249,000 - $274,000
4
Beds
3
Baths
1,501
Sq Ft
$172/Sq Ft
Est. Value
About This Home
This home is located at 1907 34th St, Des Moines, IA 50310 and is currently estimated at $258,168, approximately $171 per square foot. 1907 34th St is a home located in Polk County with nearby schools including Monroe Elementary School, Meredith Middle School, and Hoover High School.
Ownership History
Date
Name
Owned For
Owner Type
Purchase Details
Closed on
Oct 14, 2013
Sold by
Lewis Darla B
Bought by
Hupp Ricky
Current Estimated Value
Home Financials for this Owner
Home Financials are based on the most recent Mortgage that was taken out on this home.
Original Mortgage
$55,000
Outstanding Balance
$41,456
Interest Rate
4.58%
Mortgage Type
VA
Estimated Equity
$216,712
Purchase Details
Closed on
Jul 14, 2010
Sold by
Lewis William P and Lewis Darla B
Bought by
Lewis Darla B
Create a Home Valuation Report for This Property
The Home Valuation Report is an in-depth analysis detailing your home's value as well as a comparison with similar homes in the area
Home Values in the Area
Average Home Value in this Area
Purchase History
| Date | Buyer | Sale Price | Title Company |
|---|---|---|---|
| Hupp Ricky | $55,000 | None Available | |
| Lewis Darla B | -- | None Available |
Source: Public Records
Mortgage History
| Date | Status | Borrower | Loan Amount |
|---|---|---|---|
| Open | Hupp Ricky | $55,000 |
Source: Public Records
Tax History Compared to Growth
Tax History
| Year | Tax Paid | Tax Assessment Tax Assessment Total Assessment is a certain percentage of the fair market value that is determined by local assessors to be the total taxable value of land and additions on the property. | Land | Improvement |
|---|---|---|---|---|
| 2025 | $3,832 | $235,000 | $52,700 | $182,300 |
| 2024 | $3,832 | $213,900 | $47,800 | $166,100 |
| 2023 | $3,850 | $213,900 | $47,800 | $166,100 |
| 2022 | $3,818 | $175,600 | $41,300 | $134,300 |
| 2021 | $3,694 | $175,600 | $41,300 | $134,300 |
| 2020 | $3,830 | $159,900 | $37,800 | $122,100 |
| 2019 | $3,468 | $159,900 | $37,800 | $122,100 |
| 2018 | $3,426 | $140,800 | $33,100 | $107,700 |
| 2017 | $3,106 | $140,800 | $33,100 | $107,700 |
| 2016 | $3,018 | $126,600 | $29,500 | $97,100 |
| 2015 | $3,018 | $126,600 | $29,500 | $97,100 |
| 2014 | $3,008 | $125,200 | $27,000 | $98,200 |
Source: Public Records
Map
Nearby Homes