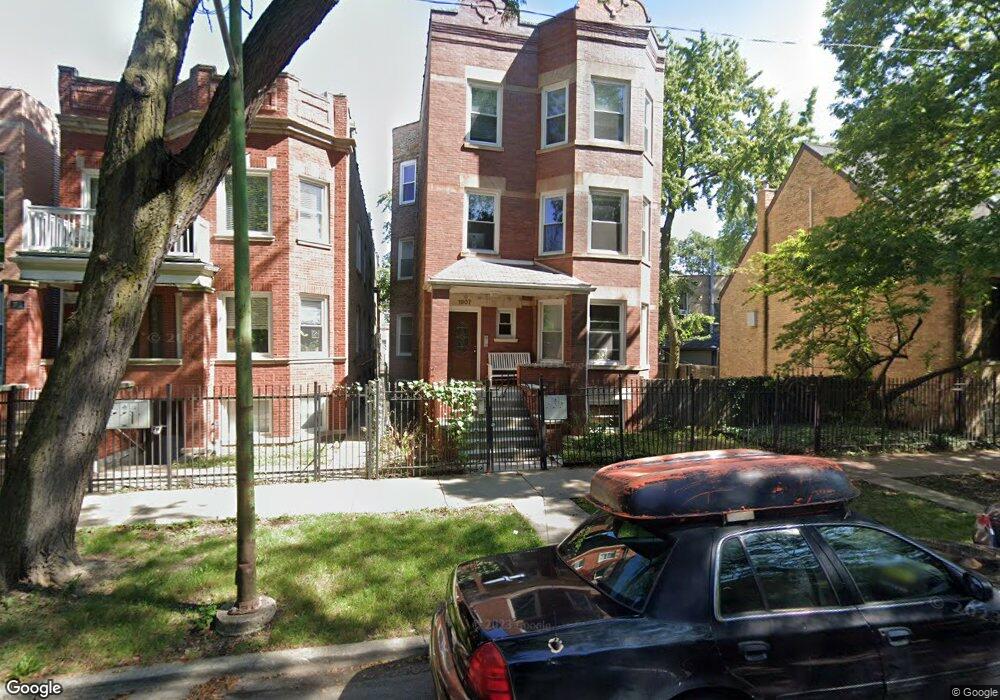
1907 N Whipple St Unit 2 Chicago, IL 60647
Logan Square NeighborhoodEstimated Value: $370,706 - $592,000
2
Beds
3
Baths
1,500
Sq Ft
$304/Sq Ft
Est. Value
About This Home
This home is located at 1907 N Whipple St Unit 2, Chicago, IL 60647 and is currently estimated at $455,927, approximately $303 per square foot. 1907 N Whipple St Unit 2 is a home located in Cook County with nearby schools including Yates Elementary School, Clemente Community Academy High School, and St. Sylvester School.
Ownership History
Date
Name
Owned For
Owner Type
Purchase Details
Closed on
Apr 28, 2023
Sold by
Kanaar Michelle S and Kanaar Gregory
Bought by
Michelle Kanaar Declaration Of Trust and Kanaar
Current Estimated Value
Purchase Details
Closed on
Aug 16, 2018
Sold by
Olaguez Jose J
Bought by
Kanaar Michelle S
Purchase Details
Closed on
Mar 18, 2003
Sold by
Varjavandi Navid J
Bought by
Olaguez Jose J
Home Financials for this Owner
Home Financials are based on the most recent Mortgage that was taken out on this home.
Original Mortgage
$172,800
Interest Rate
4.75%
Mortgage Type
Purchase Money Mortgage
Purchase Details
Closed on
Apr 20, 2001
Sold by
Chicago Land Trust Company
Bought by
Varjavandi Navid J
Home Financials for this Owner
Home Financials are based on the most recent Mortgage that was taken out on this home.
Original Mortgage
$155,900
Interest Rate
8.37%
Create a Home Valuation Report for This Property
The Home Valuation Report is an in-depth analysis detailing your home's value as well as a comparison with similar homes in the area
Home Values in the Area
Average Home Value in this Area
Purchase History
| Date | Buyer | Sale Price | Title Company |
|---|---|---|---|
| Michelle Kanaar Declaration Of Trust | -- | Truly Title | |
| Kanaar Michelle S | $335,000 | Affinity Title Services Llc | |
| Olaguez Jose J | $216,000 | Stewart Title | |
| Varjavandi Navid J | $196,500 | -- |
Source: Public Records
Mortgage History
| Date | Status | Borrower | Loan Amount |
|---|---|---|---|
| Previous Owner | Olaguez Jose J | $172,800 | |
| Previous Owner | Varjavandi Navid J | $155,900 |
Source: Public Records
Tax History Compared to Growth
Tax History
| Year | Tax Paid | Tax Assessment Tax Assessment Total Assessment is a certain percentage of the fair market value that is determined by local assessors to be the total taxable value of land and additions on the property. | Land | Improvement |
|---|---|---|---|---|
| 2024 | $3,924 | $46,253 | $11,917 | $34,336 |
| 2023 | $3,803 | $21,850 | $5,426 | $16,424 |
| 2022 | $3,803 | $21,850 | $5,426 | $16,424 |
| 2021 | $3,736 | $21,849 | $5,426 | $16,423 |
| 2020 | $4,327 | $22,458 | $5,426 | $17,032 |
| 2019 | $4,317 | $24,838 | $5,426 | $19,412 |
| 2018 | $4,228 | $24,838 | $5,426 | $19,412 |
| 2017 | $2,508 | $15,027 | $4,788 | $10,239 |
| 2016 | $2,510 | $15,027 | $4,788 | $10,239 |
| 2015 | $2,273 | $15,027 | $4,788 | $10,239 |
| 2014 | $2,241 | $14,645 | $4,309 | $10,336 |
| 2013 | $2,185 | $14,645 | $4,309 | $10,336 |
Source: Public Records
Map
Nearby Homes
- 1918 N Humboldt Blvd
- 1922 N Humboldt Blvd
- 1943 N Whipple St
- 3021 W Armitage Ave Unit 404
- 1949 N Whipple St Unit 1
- 1902 N Albany Ave
- 1837 N Albany Ave
- 1925 N Humboldt Blvd Unit P14
- 3060 W Armitage Ave
- 2014 N Whipple St
- 2019 N Whipple St Unit 1
- 2026 N Humboldt Blvd
- 2032 N Whipple St
- 2036 N Humboldt Blvd Unit 1E
- 1739 N Whipple St Unit 1
- 1806 N Richmond St
- 1918 N Kedzie Ave
- 1928 N Kedzie Ave Unit 306
- 1928 N Kedzie Ave Unit 403
- 1925 N Francisco Ave
- 1907 N Whipple St Unit 2
- 1907 N Whipple St Unit 3
- 1911 N Whipple St Unit 2
- 3030 W Cortland St
- 3030 W Cortland St
- 3024 W Cortland St
- 1915 N Whipple St Unit 1
- 1915 N Whipple St Unit 2
- 1919 N Whipple St Unit 2
- 1906 N Whipple St Unit 103
- 1906 N Whipple St
- 1906 N Whipple St Unit 1
- 1906 N Whipple St Unit GDN
- 1906 N Whipple St Unit 2
- 1906 N Whipple St Unit 3
- 1904 N Whipple St Unit 103
- 1904 N Whipple St Unit 1
- 1904 N Whipple St
- 1904 N Whipple St Unit 3
- 1904 N Whipple St Unit 2