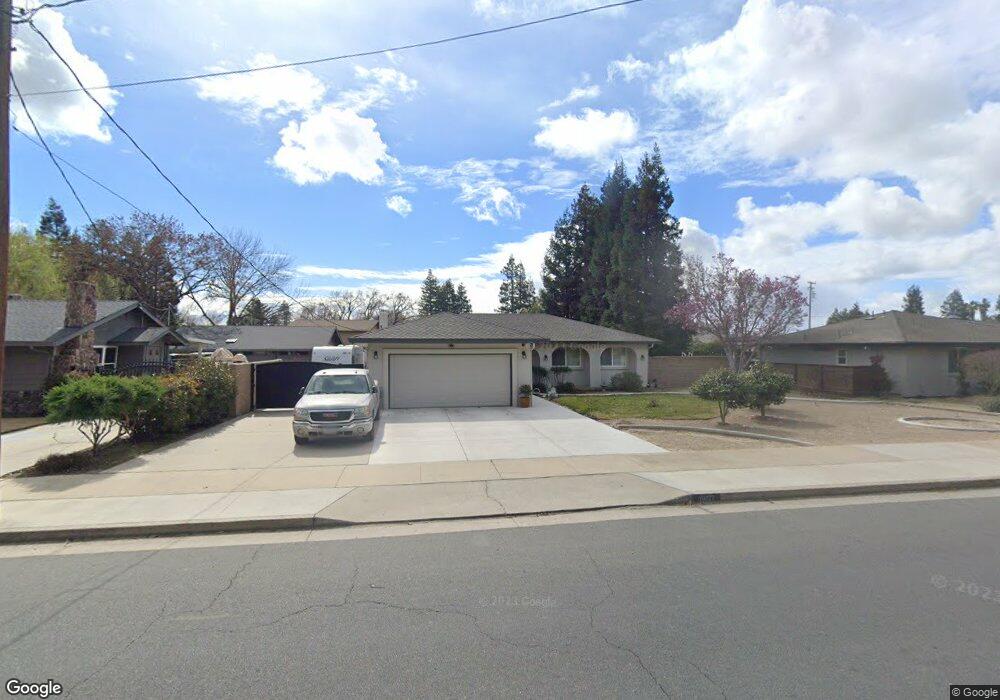
19077 Fowler Rd Turlock, CA 95380
Estimated Value: $399,000 - $693,000
3
Beds
2
Baths
1,562
Sq Ft
$321/Sq Ft
Est. Value
About This Home
This home is located at 19077 Fowler Rd, Turlock, CA 95380 and is currently estimated at $501,500, approximately $321 per square foot. 19077 Fowler Rd is a home located in Merced County with nearby schools including Hilmar High School, Fusion Charter, and Sacred Heart Elementary School.
Ownership History
Date
Name
Owned For
Owner Type
Purchase Details
Closed on
Apr 14, 2009
Sold by
Northcut Carl
Bought by
Northcutt Carl and Northcutt Stephanie L
Current Estimated Value
Home Financials for this Owner
Home Financials are based on the most recent Mortgage that was taken out on this home.
Original Mortgage
$200,000
Outstanding Balance
$126,974
Interest Rate
5.02%
Mortgage Type
New Conventional
Estimated Equity
$374,526
Purchase Details
Closed on
Mar 13, 2003
Sold by
Clark Thomas and Clark Margaret N
Bought by
Northcutt Carl
Home Financials for this Owner
Home Financials are based on the most recent Mortgage that was taken out on this home.
Original Mortgage
$210,820
Interest Rate
5.79%
Purchase Details
Closed on
Oct 15, 1997
Sold by
Brassfield Charles D and Brassfield Julie A
Bought by
Clark Thomas and Clark Margaret N
Home Financials for this Owner
Home Financials are based on the most recent Mortgage that was taken out on this home.
Original Mortgage
$135,000
Interest Rate
7.3%
Create a Home Valuation Report for This Property
The Home Valuation Report is an in-depth analysis detailing your home's value as well as a comparison with similar homes in the area
Home Values in the Area
Average Home Value in this Area
Purchase History
| Date | Buyer | Sale Price | Title Company |
|---|---|---|---|
| Northcutt Carl | -- | Stewart Title Of California | |
| Northcutt Carl | $222,000 | Chicago Title Company | |
| Clark Thomas | $145,000 | North American Title Co |
Source: Public Records
Mortgage History
| Date | Status | Borrower | Loan Amount |
|---|---|---|---|
| Open | Northcutt Carl | $200,000 | |
| Closed | Northcutt Carl | $210,820 | |
| Previous Owner | Clark Thomas | $135,000 |
Source: Public Records
Tax History Compared to Growth
Tax History
| Year | Tax Paid | Tax Assessment Tax Assessment Total Assessment is a certain percentage of the fair market value that is determined by local assessors to be the total taxable value of land and additions on the property. | Land | Improvement |
|---|---|---|---|---|
| 2025 | $3,410 | $321,511 | $65,166 | $256,345 |
| 2024 | $3,410 | $315,208 | $63,889 | $251,319 |
| 2023 | $3,315 | $309,029 | $62,637 | $246,392 |
| 2022 | $3,270 | $302,970 | $61,409 | $241,561 |
| 2021 | $3,214 | $297,030 | $60,205 | $236,825 |
| 2020 | $3,200 | $293,985 | $59,588 | $234,397 |
| 2019 | $3,172 | $288,221 | $58,420 | $229,801 |
| 2018 | $2,719 | $264,000 | $50,000 | $214,000 |
| 2017 | $2,636 | $256,500 | $50,000 | $206,500 |
| 2016 | $2,598 | $253,000 | $45,000 | $208,000 |
| 2015 | $2,524 | $245,000 | $40,000 | $205,000 |
| 2014 | $2,028 | $198,000 | $30,000 | $168,000 |
Source: Public Records
Map
Nearby Homes
- 10401 Golf Link Rd
- 18365 E Clausen Rd
- 209 E Clausen Rd
- 207 E Clausen Rd
- 119 E Clausen Rd
- 3924 Lander Ave
- 17742 W Bradbury Rd
- 1118 E Harding Rd
- 17572 W Bradbury Rd
- 2901 Youngstown Rd
- 8683 Verona Way
- 8684 N Privado Ct
- 19960 American Ave Unit 36
- 19960 American Ave Unit 35
- 19960 American Ave Unit 9
- 20378 Amethyst Dr
- 19667 American Ave Unit 38
- 8455 Kimberly Way
- 8291 Bridgeport Dr
- 9840 Douglas Ave
- 19061 Fowler Rd
- 19097 Fowler Ave
- 19097 Fowler Rd
- 10450 Lana Ln
- 19043 Fowler Rd
- 10444 Lana Ln
- 10485 Lana Ln
- 10451 Lana Ln
- 10455 Lana Ln
- 10445 Lana Ln
- 10440 Lana Ln
- 10487 Golf Rd
- 10487 Golf Link Rd
- 10471 Golf Rd
- 10471 Golf Link Rd
- 10443 Lana Ln
- 10453 Golf Rd
- 10453 Golf Link Rd
- 10435 Golf Rd
- 19149 Fowler Rd