1908 Piimauna Place Honolulu, HI 96821
Kuliouou-Kalani Iki NeighborhoodEstimated Value: $2,838,000 - $5,207,000
5
Beds
6
Baths
4,723
Sq Ft
$869/Sq Ft
Est. Value
About This Home
This home is located at 1908 Piimauna Place, Honolulu, HI 96821 and is currently estimated at $4,105,610, approximately $869 per square foot. 1908 Piimauna Place is a home located in Honolulu County with nearby schools including Aina Haina Elementary School, Niu Valley Middle School, and Kalani High School.
Ownership History
Date
Name
Owned For
Owner Type
Purchase Details
Closed on
Dec 13, 2021
Sold by
Ching Connie O L
Bought by
Marital Trust
Current Estimated Value
Purchase Details
Closed on
May 4, 2010
Sold by
Ching Spencer Wun Kwock and Ching Connie Oy Ling
Bought by
Ching Spencer W K and Ching Connie O L
Purchase Details
Closed on
Jul 31, 2007
Sold by
Kadzielawa Kris and Kadzielawa Maria Valldares
Bought by
Ching Connie Oy Ling and Ching Spencer Wun Kwock
Purchase Details
Closed on
Jul 12, 2002
Sold by
Mak Michael S and Kiung Michele
Bought by
Kadzielawa Kris and Kadzielawa Maria Valldares
Purchase Details
Closed on
Jan 23, 1998
Sold by
Nakazawa Shinsuke
Bought by
Mak Michael S and Kiung Michele
Purchase Details
Closed on
Dec 5, 1995
Sold by
Gentry Waialae Iki V Partners
Bought by
Five Star Holdings Lc
Create a Home Valuation Report for This Property
The Home Valuation Report is an in-depth analysis detailing your home's value as well as a comparison with similar homes in the area
Home Values in the Area
Average Home Value in this Area
Purchase History
| Date | Buyer | Sale Price | Title Company |
|---|---|---|---|
| Marital Trust | -- | None Listed On Document | |
| Ching Connie O L | -- | None Available | |
| Ching Connie O L | -- | None Available | |
| Ching Spencer W K | -- | None Available | |
| Ching Spencer Wun Kwock | -- | None Available | |
| Ching Connie Oy Ling | $788,000 | Fam | |
| Kadzielawa Kris | $430,000 | Old Republic Title & Escrow | |
| Mak Michael S | $285,000 | -- | |
| Nakazawa Shinsuke | $1,000 | -- | |
| Five Star Holdings Lc | $377,400 | Security Title Corporation |
Source: Public Records
Tax History Compared to Growth
Tax History
| Year | Tax Paid | Tax Assessment Tax Assessment Total Assessment is a certain percentage of the fair market value that is determined by local assessors to be the total taxable value of land and additions on the property. | Land | Improvement |
|---|---|---|---|---|
| 2025 | $25,997 | $2,850,100 | $1,487,300 | $1,362,800 |
| 2024 | $25,997 | $2,929,600 | $1,487,300 | $1,442,300 |
| 2023 | $26,965 | $3,014,500 | $1,405,600 | $1,608,900 |
| 2022 | $21,597 | $2,628,300 | $1,242,200 | $1,386,100 |
| 2021 | $24,578 | $2,912,200 | $1,242,200 | $1,670,000 |
| 2020 | $23,730 | $2,831,400 | $1,291,200 | $1,540,200 |
| 2019 | $23,046 | $2,766,300 | $1,291,200 | $1,475,100 |
| 2018 | $19,469 | $2,663,200 | $1,242,200 | $1,421,000 |
| 2017 | $20,171 | $2,741,200 | $1,176,800 | $1,564,400 |
| 2016 | $15,649 | $2,608,100 | $1,160,500 | $1,447,600 |
| 2015 | $17,189 | $2,864,800 | $1,291,200 | $1,573,600 |
| 2014 | -- | $2,261,900 | $1,037,900 | $1,224,000 |
Source: Public Records
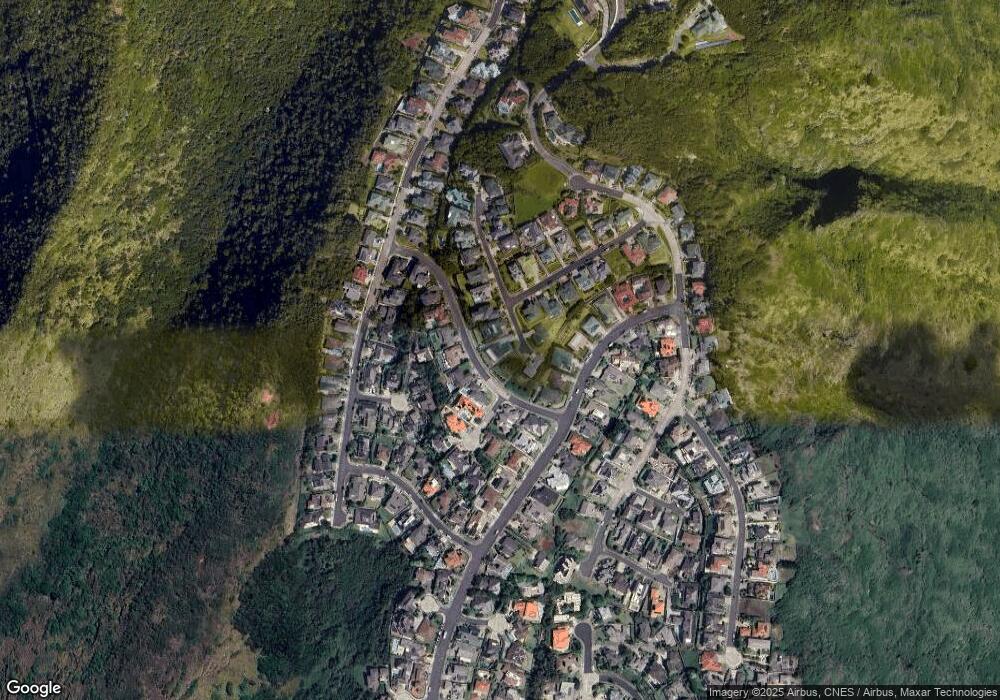
Map
Nearby Homes
- 2067 Laukahi St
- 5492A Poola St Unit 20B
- 888 Ahuwale St
- 835 Ahuwale St
- 907 Ahuwale St
- 809 Hao St
- 5442 Poola St
- 5436 Poola St
- 5201 Kuaiwi Place
- 855 Kainoa Place
- 5404 Poola St
- 817 Ekoa Place
- 1630 Kalaniiki St Unit 31
- 5197 Poola St
- 415 Kiholo St
- 2234 Aha Niu Place
- 2500 Aha Aina Place Unit H
- 626 W Hind Dr
- 1410 Ehupua St
- 1974 Halekoa Dr
- 1914 Piimauna Place
- 1900 Piimauna Place
- 1920 Piimauna Place
- 1905 Piimauna Place
- 2255 Nuna St
- 2263 Nuna St
- 2249 Nuna St
- 2195 Piimauna St
- 2241 Nuna St
- 1928 Piimauna Place
- 2176 Laukahi St
- 2182 Laukahi St
- 1916 Nuna Place
- 2168 Laukahi St
- 2203 Piimauna St
- 1919 Nuna Place Unit 2212
- 2233 Nuna St
- 2196 Piimauna St
- 2188 Laukahi St
- 1936 Piimauna Place